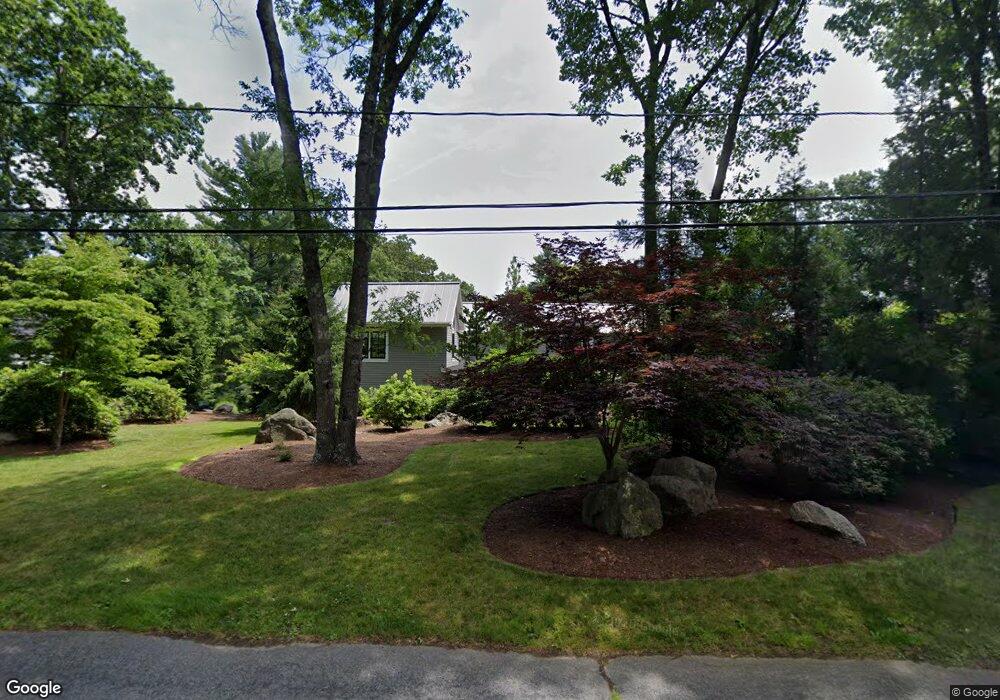
132 Beaver Rd Weston, MA 02493
Estimated Value: $2,827,000 - $4,494,000
2
Beds
4
Baths
2,480
Sq Ft
$1,529/Sq Ft
Est. Value
About This Home
This home is located at 132 Beaver Rd, Weston, MA 02493 and is currently estimated at $3,791,943, approximately $1,529 per square foot. 132 Beaver Rd is a home located in Middlesex County with nearby schools including Country Elementary School, Woodland Elementary School, and Field Elementary School.
Ownership History
Date
Name
Owned For
Owner Type
Purchase Details
Closed on
Jun 16, 2010
Sold by
Boorky Leah F and Keller Judith D
Bought by
Kosowsky Richard P and Kosowsky Patricia R
Current Estimated Value
Create a Home Valuation Report for This Property
The Home Valuation Report is an in-depth analysis detailing your home's value as well as a comparison with similar homes in the area
Home Values in the Area
Average Home Value in this Area
Purchase History
| Date | Buyer | Sale Price | Title Company |
|---|---|---|---|
| Kosowsky Richard P | $1,084,150 | -- |
Source: Public Records
Tax History
| Year | Tax Paid | Tax Assessment Tax Assessment Total Assessment is a certain percentage of the fair market value that is determined by local assessors to be the total taxable value of land and additions on the property. | Land | Improvement |
|---|---|---|---|---|
| 2025 | $39,233 | $3,534,500 | $1,418,100 | $2,116,400 |
| 2024 | $38,505 | $3,462,700 | $1,418,100 | $2,044,600 |
| 2023 | $39,209 | $3,311,600 | $1,418,100 | $1,893,500 |
| 2022 | $38,484 | $3,004,200 | $1,351,800 | $1,652,400 |
| 2021 | $37,150 | $2,862,100 | $1,288,200 | $1,573,900 |
| 2020 | $37,169 | $2,897,000 | $1,288,200 | $1,608,800 |
| 2019 | $36,548 | $2,902,900 | $1,288,200 | $1,614,700 |
| 2018 | $36,532 | $2,920,200 | $1,288,200 | $1,632,000 |
| 2017 | $36,426 | $2,937,600 | $1,288,200 | $1,649,400 |
| 2016 | $35,930 | $2,954,800 | $1,288,200 | $1,666,600 |
| 2015 | $35,167 | $2,863,800 | $1,227,600 | $1,636,200 |
Source: Public Records
Map
Nearby Homes
- 79 Walnut Rd
- 719 Wellesley St
- 15 Rockport Rd
- 63 Sylvan Ln
- 19 Northgate Rd
- 6 Meadowbrook Rd
- 169 Hickory Rd
- 120 Rockport Rd
- 53 Chesterton Rd
- 6 Boulder Brook Rd
- 568 Wellesley St
- 8 Oakdale Ave
- 6 Briar Ln
- 20 Parker Rd
- 16 Sunnyside Ave
- 38 Parker Rd
- 1 Sunnyside Ave
- 90 Elmwood Rd
- 162 Hampshire Rd
- 23 Pilgrim Rd
Your Personal Tour Guide
Ask me questions while you tour the home.