
Landlord's Agent in 2021
Gail Robinson
William Raveis Real Estate
(203) 521-0768
43 in this area
48 Total Sales
Estimated Value: $195,000 - $327,000
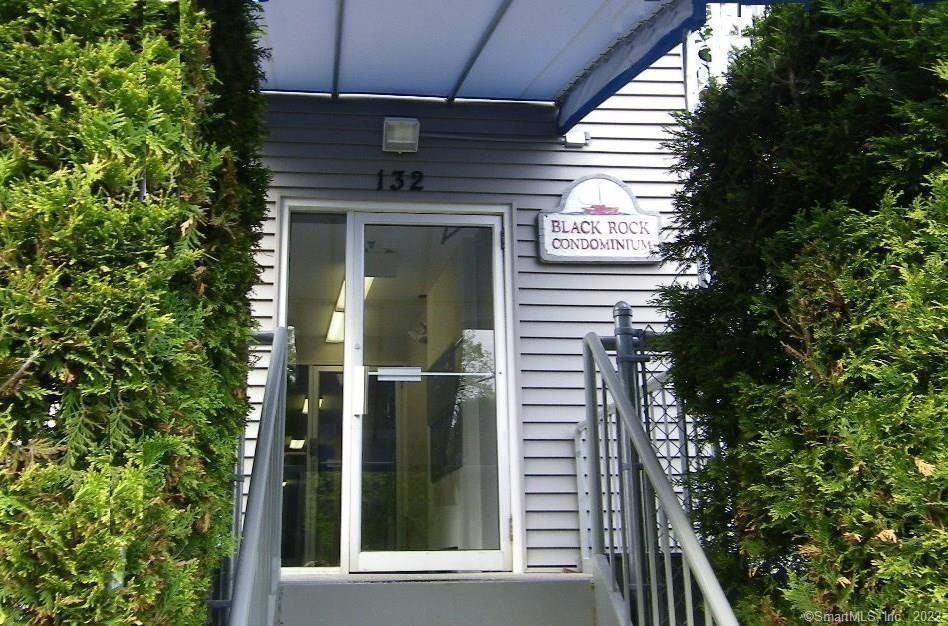
Walk to Fairfield Metro train station and Black Rock Arts & Entertainment District. Newly painted and refreshed. Three spacious bedrooms including a master bedroom suite, two full bathrooms, washer and dryer in unit, and central air. Hardwood floors in living room and dining room. Gas heat, baseboard. Kitchen w. tile floor and dishwasher. Hardwood floor in living room w. sliders to balcony. Large closets. Two reserved parking spaces under building. Credit check required. First floor unit. No smoking. No pets allowed per building rules. Tenants must follow building Rules & Regs. Tenant must fill out Landlord's Application (see Supplements).
Last Agent to Rent the Property
William Raveis Real Estate License #RES.0772823 Listed on: 09/14/2021
| Date | Buyer | Sale Price | Title Company |
|---|---|---|---|
| Yoder Jeffrey | -- | -- | |
| Yoder Jeffrey | -- | -- | |
| Yoder Jeffrey | $105,000 | -- | |
| Yoder Jeffrey | $105,000 | -- | |
| Jackson Horace W | $87,000 | -- | |
| Jackson Horace W | $87,000 | -- | |
| Monterey Properties | $35,000 | -- | |
| Monterey Properties | $35,000 | -- |
| Date | Status | Borrower | Loan Amount |
|---|---|---|---|
| Open | Monterey Properties | $84,450 | |
| Closed | Monterey Properties | $84,450 |
| Date | Event | Price | List to Sale | Price per Sq Ft |
|---|---|---|---|---|
| 10/13/2021 10/13/21 | Rented | $1,850 | -2.6% | -- |
| 10/10/2021 10/10/21 | Under Contract | -- | -- | -- |
| 09/30/2021 09/30/21 | Price Changed | $1,900 | 0.0% | $2 / Sq Ft |
| 09/30/2021 09/30/21 | For Rent | $1,900 | +5.6% | -- |
| 09/18/2021 09/18/21 | Off Market | $1,800 | -- | -- |
| 09/14/2021 09/14/21 | For Rent | $1,800 | +12.5% | -- |
| 03/06/2020 03/06/20 | Rented | $1,600 | 0.0% | -- |
| 03/06/2020 03/06/20 | Under Contract | -- | -- | -- |
| 12/05/2019 12/05/19 | Price Changed | $1,600 | -5.9% | $2 / Sq Ft |
| 10/26/2019 10/26/19 | For Rent | $1,700 | 0.0% | -- |
| 10/21/2019 10/21/19 | Off Market | $1,700 | -- | -- |
| 09/30/2019 09/30/19 | For Rent | $1,700 | +6.3% | -- |
| 03/30/2018 03/30/18 | Rented | $1,600 | 0.0% | -- |
| 03/29/2018 03/29/18 | Under Contract | -- | -- | -- |
| 11/28/2017 11/28/17 | For Rent | $1,600 | 0.0% | -- |
| 07/10/2014 07/10/14 | Rented | $1,600 | 0.0% | -- |
| 07/10/2014 07/10/14 | For Rent | $1,600 | +6.7% | -- |
| 03/20/2013 03/20/13 | Rented | $1,500 | -9.1% | -- |
| 02/18/2013 02/18/13 | Under Contract | -- | -- | -- |
| 01/01/2013 01/01/13 | For Rent | $1,650 | -- | -- |
| Year | Tax Paid | Tax Assessment Tax Assessment Total Assessment is a certain percentage of the fair market value that is determined by local assessors to be the total taxable value of land and additions on the property. | Land | Improvement |
|---|---|---|---|---|
| 2025 | $2,730 | $62,840 | $0 | $62,840 |
| 2024 | $2,730 | $62,840 | $0 | $62,840 |
| 2023 | $2,730 | $62,840 | $0 | $62,840 |
| 2022 | $2,730 | $62,840 | $0 | $62,840 |
| 2021 | $2,730 | $62,840 | $0 | $62,840 |
| 2020 | $2,886 | $53,450 | $0 | $53,450 |
| 2019 | $2,886 | $53,450 | $0 | $53,450 |
| 2018 | $2,906 | $53,450 | $0 | $53,450 |
| 2017 | $2,906 | $53,450 | $0 | $53,450 |
| 2016 | $2,906 | $53,450 | $0 | $53,450 |
| 2015 | $5,441 | $128,940 | $0 | $128,940 |
| 2014 | $5,441 | $128,940 | $0 | $128,940 |
Landlord's Agent in 2021
Gail Robinson
William Raveis Real Estate
(203) 521-0768
43 in this area
48 Total Sales
Tenant's Agent in 2021
Filomena Ramos
Coldwell Banker Realty
(203) 258-1755
24 Total Sales
C
Buyer's Agent in 2020
Carolyn Lockley
Keller Williams Realty Prtnrs.
(203) 526-7390
6 Total Sales
K
Buyer's Agent in 2018
Kristopher Milardo
Berkshire Hathaway Home Services
Buyer's Agent in 2014
Joy Serafin-Cehovsky
Higgins Group Real Estate
(203) 521-8965
7 Total Sales
C
Buyer's Agent in 2013
Cecille Agulay
Equity Realty Group, LLC
(475) 259-5143
6 Total Sales
Source: SmartMLS
MLS Number: 170437350
APN: BRID-000101-000010K-000006
Disclaimer: Certain information contained herein is derived from information provided by parties other than Homes.com. All information provided is deemed reliable, but is not guaranteed to be accurate and should be independently verified.
![]() IDX information is provided exclusively for personal, non-commercial use, and may not be used for any purpose other than to identify prospective properties consumers may be interested in purchasing. Information is deemed reliable but not guaranteed.
IDX information is provided exclusively for personal, non-commercial use, and may not be used for any purpose other than to identify prospective properties consumers may be interested in purchasing. Information is deemed reliable but not guaranteed.