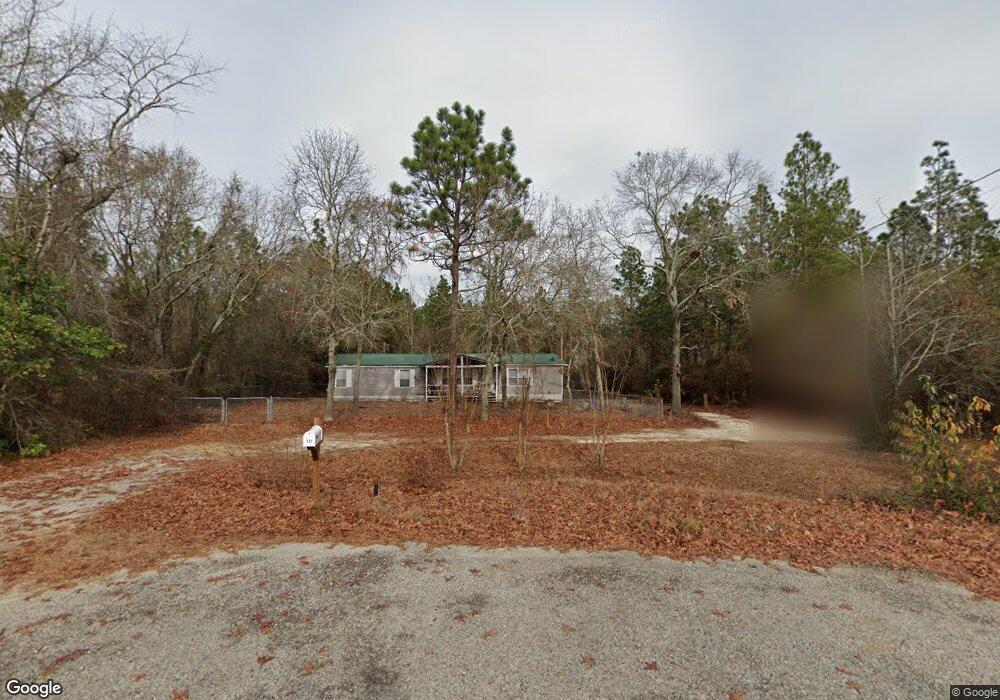
132 Boiling Springs Ln Lexington, SC 29073
Edmund NeighborhoodEstimated Value: $82,958 - $181,000
--
Bed
--
Bath
1,680
Sq Ft
$85/Sq Ft
Est. Value
About This Home
This home is located at 132 Boiling Springs Ln, Lexington, SC 29073 and is currently estimated at $143,490, approximately $85 per square foot. 132 Boiling Springs Ln is a home with nearby schools including Congaree Elementary School, R. H. Fulmer Middle, and Airport High School.
Ownership History
Date
Name
Owned For
Owner Type
Purchase Details
Closed on
Oct 22, 2020
Sold by
Us Bank National Association
Bought by
Lieve Enterprises 120330 Llc
Current Estimated Value
Home Financials for this Owner
Home Financials are based on the most recent Mortgage that was taken out on this home.
Original Mortgage
$11,050
Outstanding Balance
$9,810
Interest Rate
2.8%
Mortgage Type
Commercial
Estimated Equity
$133,680
Purchase Details
Closed on
Aug 31, 2017
Sold by
Lexington County
Bought by
Homegold Home Equity Loan Trust 1999- and Us Bank National Associat Ion
Home Financials for this Owner
Home Financials are based on the most recent Mortgage that was taken out on this home.
Interest Rate
3.82%
Purchase Details
Closed on
Apr 29, 2011
Sold by
Estate Of Ella Mae Gillian and Smith Terry H
Bought by
Trust Created For Kindall L Gillian and Will Of Ella Mae Gillian
Create a Home Valuation Report for This Property
The Home Valuation Report is an in-depth analysis detailing your home's value as well as a comparison with similar homes in the area
Home Values in the Area
Average Home Value in this Area
Purchase History
| Date | Buyer | Sale Price | Title Company |
|---|---|---|---|
| Lieve Enterprises 120330 Llc | $20,000 | None Available | |
| Homegold Home Equity Loan Trust 1999- | -- | -- | |
| Trust Created For Kindall L Gillian | -- | -- |
Source: Public Records
Mortgage History
| Date | Status | Borrower | Loan Amount |
|---|---|---|---|
| Open | Lieve Enterprises 120330 Llc | $11,050 | |
| Previous Owner | Homegold Home Equity Loan Trust 1999- | -- |
Source: Public Records
Tax History Compared to Growth
Tax History
| Year | Tax Paid | Tax Assessment Tax Assessment Total Assessment is a certain percentage of the fair market value that is determined by local assessors to be the total taxable value of land and additions on the property. | Land | Improvement |
|---|---|---|---|---|
| 2024 | $432 | $1,248 | $1,080 | $168 |
| 2023 | $432 | $1,248 | $1,080 | $168 |
| 2022 | $403 | $1,248 | $1,080 | $168 |
| 2020 | $388 | $1,248 | $1,080 | $168 |
| 2019 | $391 | $1,248 | $1,080 | $168 |
| 2018 | $388 | $1,248 | $1,080 | $168 |
| 2017 | $382 | $1,248 | $1,080 | $168 |
| 2016 | $386 | $1,248 | $1,080 | $168 |
| 2014 | $314 | $1,200 | $1,080 | $120 |
| 2013 | -- | $1,480 | $720 | $760 |
Source: Public Records
Map
Nearby Homes
- 1128 Citation St
- 425 Blue Artesian Way
- 522 Sasanqua Ln
- 631 Rose Quartz Ln
- 1158 Ederbach Dr
- 1423 Tanreall Dr
- 140 Ellie Ln
- 2024 Cold Rocks Way
- 607 Rose Quartz Ln
- 603 Rose Quartz Ln
- 146 Belfast Way
- 2806 S Lake Dr
- The Idlewild Plan at Belgrave
- The Garland Plan at Belgrave
- The Tyndall Plan at Belgrave
- The Jefferson Plan at Belgrave
- The Yarmouth Plan at Belgrave
- 409 Delaware St
- 212 Socrates St
- 3414 Matrim Way
- 136 Boiling Springs Ln
- 128 Boiling Springs Ln
- 137 Boiling Springs Ln
- 2724 S Lake Dr
- 119 Boiling Springs Ln
- 146 Boiling Springs Ln
- 120 Boiling Springs Ln
- 2734 S Lake Dr
- 2734 S Lake Dr
- 537 Bristol Ln
- 433 Jedburgh Ct
- 533 Bristol Ln
- 432 Jedburgh Ct
- 2710 S Lake Dr
- 145 Boiling Springs Rd
- 429 Firbough Ct
- 429 Jedburgh Ct
- 117 Nicole Ct
- 116 Nicole Ct
- 116 Boiling Springs Ln