Estimated Value: $416,000 - $477,000
3
Beds
2
Baths
1,972
Sq Ft
$223/Sq Ft
Est. Value
About This Home
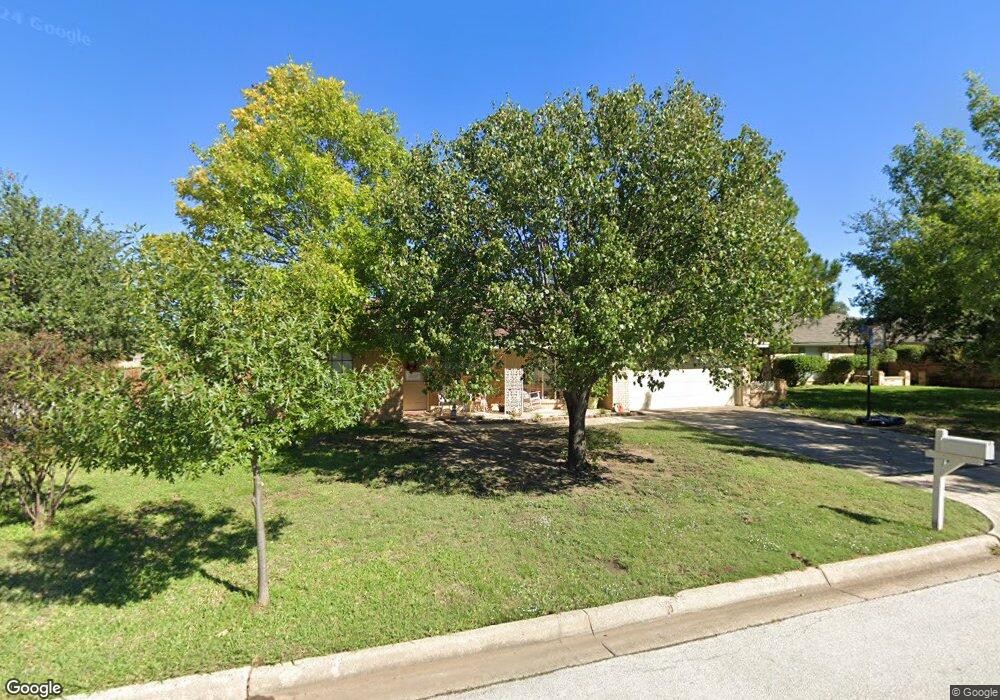
This home is located at 132 Brazil Ct, Hurst, TX 76054 and is currently estimated at $438,956, approximately $222 per square foot. 132 Brazil Ct is a home located in Tarrant County with nearby schools including Bransford Elementary School, Colleyville Middle School, and Grapevine High School.
Ownership History
Date
Name
Owned For
Owner Type
Purchase Details
Closed on
Sep 27, 1996
Sold by
Oconnor Sally Maureen
Bought by
Spalding Robert T and Spalding Tara L
Current Estimated Value
Home Financials for this Owner
Home Financials are based on the most recent Mortgage that was taken out on this home.
Original Mortgage
$85,276
Outstanding Balance
$7,705
Interest Rate
7.91%
Mortgage Type
FHA
Estimated Equity
$431,251
Purchase Details
Closed on
Feb 25, 1987
Sold by
Dickinson Lynn C and Dickinson Paula A
Bought by
Merrill Lynch Relocation Management Inc
Home Financials for this Owner
Home Financials are based on the most recent Mortgage that was taken out on this home.
Original Mortgage
$67,650
Interest Rate
7.9%
Create a Home Valuation Report for This Property
The Home Valuation Report is an in-depth analysis detailing your home's value as well as a comparison with similar homes in the area
Home Values in the Area
Average Home Value in this Area
Purchase History
| Date | Buyer | Sale Price | Title Company |
|---|---|---|---|
| Spalding Robert T | -- | Commonwealth Land Title | |
| Merrill Lynch Relocation Management Inc | -- | Stewart Title |
Source: Public Records
Mortgage History
| Date | Status | Borrower | Loan Amount |
|---|---|---|---|
| Open | Spalding Robert T | $85,276 | |
| Previous Owner | Merrill Lynch Relocation Management Inc | $67,650 |
Source: Public Records
Tax History Compared to Growth
Tax History
| Year | Tax Paid | Tax Assessment Tax Assessment Total Assessment is a certain percentage of the fair market value that is determined by local assessors to be the total taxable value of land and additions on the property. | Land | Improvement |
|---|---|---|---|---|
| 2025 | $2,691 | $393,000 | $85,000 | $308,000 |
| 2024 | $2,691 | $408,000 | $85,000 | $323,000 |
| 2023 | $5,583 | $391,000 | $85,000 | $306,000 |
| 2022 | $5,876 | $252,886 | $55,000 | $197,886 |
| 2021 | $6,365 | $252,886 | $55,000 | $197,886 |
| 2020 | $6,354 | $252,886 | $55,000 | $197,886 |
| 2019 | $6,701 | $275,000 | $55,000 | $220,000 |
| 2018 | $2,508 | $236,918 | $55,000 | $181,918 |
| 2017 | $5,624 | $256,385 | $55,000 | $201,385 |
| 2016 | $5,113 | $220,356 | $40,000 | $180,356 |
| 2015 | $4,156 | $178,000 | $25,000 | $153,000 |
| 2014 | $4,156 | $178,000 | $25,000 | $153,000 |
Source: Public Records
Map
Nearby Homes
- 2732 Woodbridge Dr
- 312 Bremen Dr
- 405 Bremen Dr
- 3713 Brentwood Ct
- 2620 Brookridge Dr
- 2844 Hurstview Dr
- 2809 Sandstone Dr
- 4600 Bransford Rd
- 2829 Sandstone Dr
- 3132 Hurstview Dr
- 2804 Ridgewood Dr
- 405 Woodbriar Ct
- 2908 Steve Dr
- 3208 Glade Pointe Ct
- 114 Glade Rd
- 712 Springhill Dr
- 112 Glade Rd
- 628 Huntwich Dr
- 712 Springwood Dr
- 305 Warbler Dr
- 128 Brazil Ct
- 133 Springhill Dr
- 129 Springhill Dr
- 200 Brazil Dr
- 124 Brazil Ct
- 133 Brazil Ct
- 129 Brazil Ct
- 201 Springhill Dr
- 125 Springhill Dr
- 201 Brazil Dr
- 204 Brazil Dr
- 125 Brazil Ct
- 205 Springhill Dr
- 121 Springhill Dr
- 120 Brazil Ct
- 205 Brazil Dr
- 132 Springhill Dr
- 128 Springhill Dr
- 208 Brazil Dr
- 200 Springhill Dr