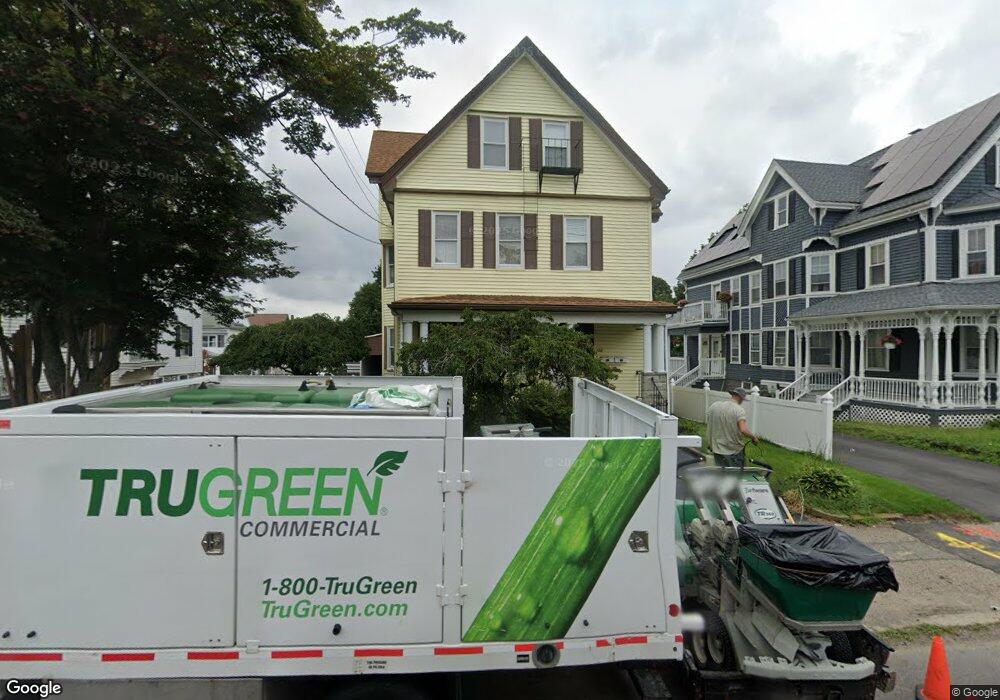
132 Broadway Taunton, MA 02780
Whittenton NeighborhoodEstimated Value: $712,000 - $784,000
6
Beds
3
Baths
3,283
Sq Ft
$229/Sq Ft
Est. Value
About This Home
This home is located at 132 Broadway, Taunton, MA 02780 and is currently estimated at $751,667, approximately $228 per square foot. 132 Broadway is a home located in Bristol County with nearby schools including Elizabeth Pole School, Taunton High School, and John F. Parker Middle School.
Ownership History
Date
Name
Owned For
Owner Type
Purchase Details
Closed on
Apr 22, 2025
Sold by
Medeiros Mary M Est and Demedeiros
Bought by
Demedeiros Steven M and Medeiros John M
Current Estimated Value
Create a Home Valuation Report for This Property
The Home Valuation Report is an in-depth analysis detailing your home's value as well as a comparison with similar homes in the area
Home Values in the Area
Average Home Value in this Area
Purchase History
| Date | Buyer | Sale Price | Title Company |
|---|---|---|---|
| Demedeiros Steven M | -- | None Available | |
| Demedeiros Steven M | -- | None Available |
Source: Public Records
Tax History Compared to Growth
Tax History
| Year | Tax Paid | Tax Assessment Tax Assessment Total Assessment is a certain percentage of the fair market value that is determined by local assessors to be the total taxable value of land and additions on the property. | Land | Improvement |
|---|---|---|---|---|
| 2025 | $7,422 | $678,400 | $99,500 | $578,900 |
| 2024 | $7,052 | $630,200 | $99,500 | $530,700 |
| 2023 | $6,676 | $554,000 | $99,500 | $454,500 |
| 2022 | $6,214 | $471,500 | $83,000 | $388,500 |
| 2021 | $5,325 | $375,000 | $75,400 | $299,600 |
| 2020 | $5,195 | $349,600 | $75,400 | $274,200 |
| 2019 | $4,830 | $306,500 | $75,400 | $231,100 |
| 2018 | $4,461 | $283,800 | $75,600 | $208,200 |
| 2017 | $0 | $252,000 | $71,700 | $180,300 |
| 2016 | $3,721 | $237,300 | $69,600 | $167,700 |
| 2015 | $3,530 | $235,200 | $69,600 | $165,600 |
| 2014 | $3,433 | $235,000 | $67,900 | $167,100 |
Source: Public Records
Map
Nearby Homes
- 9 Bradford St
- 22 John St Unit 22
- 13 Benefit St
- 6 Makepeace Ave
- 14 Wilbur St
- 9 Jefferson St
- 54 Adams St
- 37 Winter St
- 30 Buffington St
- 28 Madison St
- 5 Dean Ave
- 27 Monroe St
- 78 Arlington St Unit 2
- 78 Arlington St Unit 3
- 78 Arlington St Unit 1
- 96 Danforth St Unit 49
- 31 Church Green Unit 303
- 0 Eldridge St Unit 73454842
- 12 Chestnut St Unit A
- 12 Oxford St