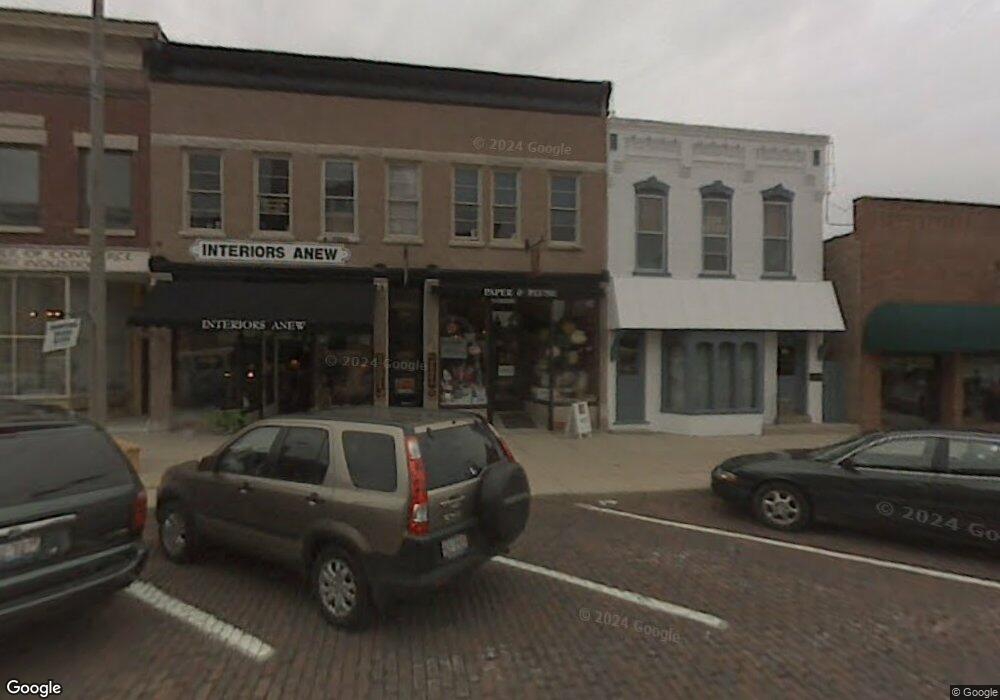
132 Cass St Unit 132-134 Woodstock, IL 60098
--
Bed
1
Bath
6,184
Sq Ft
3,485
Sq Ft Lot
About This Home
This home is located at 132 Cass St Unit 132-134, Woodstock, IL 60098. 132 Cass St Unit 132-134 is a home located in McHenry County with nearby schools including Olson Elementary School, Creekside Middle School, and Woodstock High School.
Ownership History
Date
Name
Owned For
Owner Type
Purchase Details
Closed on
Jan 27, 2022
Sold by
Ella Properties Inc
Bought by
132 Cass Street Llc
Purchase Details
Closed on
Jun 11, 2004
Sold by
Tierney Melissa H
Bought by
Ella Properties Inc
Home Financials for this Owner
Home Financials are based on the most recent Mortgage that was taken out on this home.
Original Mortgage
$328,000
Interest Rate
6%
Mortgage Type
Commercial
Purchase Details
Closed on
May 6, 2004
Sold by
Tierney Thomas M
Bought by
Tierney Melissa H
Home Financials for this Owner
Home Financials are based on the most recent Mortgage that was taken out on this home.
Original Mortgage
$328,000
Interest Rate
6%
Mortgage Type
Commercial
Purchase Details
Closed on
Jun 17, 1998
Sold by
Perez Mario and Perez Esther
Bought by
Tierney Melissa and Tierney Thomas M
Home Financials for this Owner
Home Financials are based on the most recent Mortgage that was taken out on this home.
Original Mortgage
$232,500
Interest Rate
7.22%
Mortgage Type
Commercial
Create a Home Valuation Report for This Property
The Home Valuation Report is an in-depth analysis detailing your home's value as well as a comparison with similar homes in the area
Home Values in the Area
Average Home Value in this Area
Purchase History
| Date | Buyer | Sale Price | Title Company |
|---|---|---|---|
| 132 Cass Street Llc | $321,500 | Freedom Title | |
| Ella Properties Inc | $393,000 | St | |
| Tierney Melissa H | -- | -- | |
| Tierney Melissa | $227,500 | Chicago Title |
Source: Public Records
Mortgage History
| Date | Status | Borrower | Loan Amount |
|---|---|---|---|
| Previous Owner | Ella Properties Inc | $328,000 | |
| Previous Owner | Tierney Melissa | $232,500 |
Source: Public Records
Tax History Compared to Growth
Tax History
| Year | Tax Paid | Tax Assessment Tax Assessment Total Assessment is a certain percentage of the fair market value that is determined by local assessors to be the total taxable value of land and additions on the property. | Land | Improvement |
|---|---|---|---|---|
| 2024 | $10,932 | $118,646 | $16,156 | $102,490 |
| 2023 | $10,496 | $107,294 | $14,610 | $92,684 |
| 2022 | $12,281 | $119,116 | $12,966 | $106,150 |
| 2021 | $11,745 | $111,292 | $12,114 | $99,178 |
| 2020 | $11,362 | $105,751 | $11,511 | $94,240 |
| 2019 | $11,074 | $100,946 | $10,988 | $89,958 |
| 2018 | $10,509 | $94,283 | $12,535 | $81,748 |
| 2017 | $10,379 | $88,737 | $11,798 | $76,939 |
| 2016 | $10,370 | $82,164 | $10,924 | $71,240 |
| 2013 | -- | $79,428 | $10,560 | $68,868 |
Source: Public Records
Map
Nearby Homes
- 1288 Prairie Ridge Trail
- 3848 Riverwoods Dr
- 3902 Riverwoods Dr
- 3842 Riverwoods Dr
- 3839 Riverwoods Dr
- Townsend Plan at Clublands of Antioch - Horizon Series
- Napa Plan at Clublands of Antioch - Andare Series
- 1249 Prairie Ridge Trail
- 3851 Riverwoods Dr
- 3827 Riverwoods Dr
- Meadowlark Plan at Clublands of Antioch - Horizon Series
- Rutherford Plan at Clublands of Antioch - Andare Series
- Starling Plan at Riverwoods - Single Family
- Brighton Plan at Clublands of Antioch - Horizon Series
- 3917 Riverwoods Dr
- Siena II Plan at Riverwoods - Single Family
- 3905 Riverwoods Dr
- 3821 Riverwoods Dr
- 4022 Meadowridge Rd
- Sonoma Plan at Clublands of Antioch - Andare Series
- 132 Cass St
- 132 Cass St Unit 132
- 134 Cass St Unit 2D
- 134 Cass St
- 134 Cass St Unit 2G
- 134 Cass St Unit 2B
- 134 Cass St Unit 2E
- 134 Cass St Unit 2C
- 136 Cass St
- 130 Cass St
- 138 Cass St
- 140 Cass St
- 124 Cass St
- 124 Cass St Unit 3
- 124 Cass St Unit 2
- 124 Cass St Unit 1
- 140 Route 14
- Route Route 14
- 201 Main St
- 112 Cass St