Estimated Value: $286,000 - $305,835
3
Beds
2
Baths
2,327
Sq Ft
$125/Sq Ft
Est. Value
About This Home
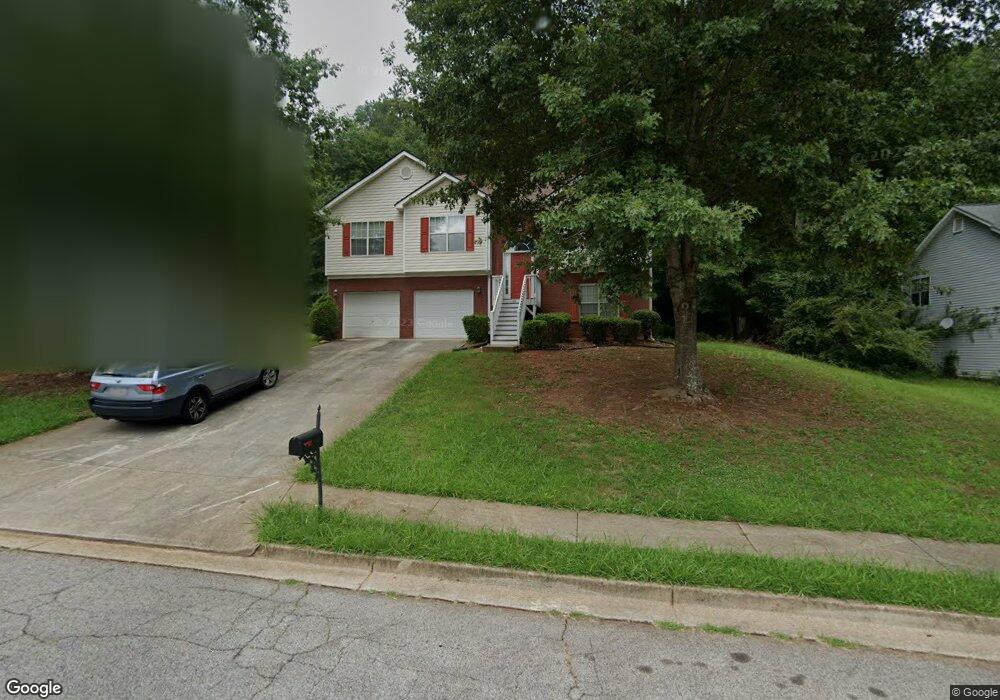
This home is located at 132 Cheryl Ct, Rex, GA 30273 and is currently estimated at $291,459, approximately $125 per square foot. 132 Cheryl Ct is a home located in Henry County with nearby schools including Cotton Indian Elementary School, Stockbridge Middle School, and Stockbridge High School.
Ownership History
Date
Name
Owned For
Owner Type
Purchase Details
Closed on
Aug 2, 2021
Sold by
Mcmillan Shaun A
Bought by
Shade Daniel T
Current Estimated Value
Home Financials for this Owner
Home Financials are based on the most recent Mortgage that was taken out on this home.
Original Mortgage
$227,950
Outstanding Balance
$206,829
Interest Rate
2.9%
Mortgage Type
New Conventional
Estimated Equity
$84,630
Purchase Details
Closed on
Apr 30, 2007
Sold by
Mitchell L Richard and Mitchell Stephanie T
Bought by
Mcmillan Shaun A and Mcmillan Judith N
Home Financials for this Owner
Home Financials are based on the most recent Mortgage that was taken out on this home.
Original Mortgage
$160,000
Interest Rate
6.11%
Mortgage Type
Stand Alone Second
Purchase Details
Closed on
Aug 30, 2001
Sold by
D & N Classic Homes Inc
Bought by
Mitchell L Richard
Home Financials for this Owner
Home Financials are based on the most recent Mortgage that was taken out on this home.
Original Mortgage
$151,002
Interest Rate
6.85%
Mortgage Type
FHA
Create a Home Valuation Report for This Property
The Home Valuation Report is an in-depth analysis detailing your home's value as well as a comparison with similar homes in the area
Home Values in the Area
Average Home Value in this Area
Purchase History
| Date | Buyer | Sale Price | Title Company |
|---|---|---|---|
| Shade Daniel T | $235,000 | -- | |
| Mcmillan Shaun A | $160,000 | -- | |
| Mitchell L Richard | $153,200 | -- |
Source: Public Records
Mortgage History
| Date | Status | Borrower | Loan Amount |
|---|---|---|---|
| Open | Shade Daniel T | $227,950 | |
| Previous Owner | Mcmillan Shaun A | $160,000 | |
| Previous Owner | Mitchell L Richard | $151,002 |
Source: Public Records
Tax History
| Year | Tax Paid | Tax Assessment Tax Assessment Total Assessment is a certain percentage of the fair market value that is determined by local assessors to be the total taxable value of land and additions on the property. | Land | Improvement |
|---|---|---|---|---|
| 2025 | $4,891 | $136,980 | $12,000 | $124,980 |
| 2024 | $4,891 | $130,360 | $12,000 | $118,360 |
| 2023 | $4,713 | $120,840 | $12,000 | $108,840 |
| 2022 | $3,683 | $94,000 | $9,776 | $84,224 |
| 2021 | $2,416 | $60,960 | $8,000 | $52,960 |
| 2020 | $2,247 | $56,560 | $8,000 | $48,560 |
| 2019 | $2,115 | $53,120 | $8,000 | $45,120 |
| 2018 | $1,984 | $49,720 | $8,000 | $41,720 |
| 2016 | $1,684 | $41,880 | $6,000 | $35,880 |
| 2015 | $1,457 | $34,880 | $4,800 | $30,080 |
| 2014 | $1,396 | $32,960 | $4,800 | $28,160 |
Source: Public Records
Map
Nearby Homes
- 6435 Cumberland Dr
- 3824 Augustine Place
- 6670 Sunset Hills Blvd
- 6661 Highway 42
- 85 Homestead Place
- 6708 Sunset Hills Blvd
- 100 Homestead Place
- 6716 Teresa Ln
- 3769 Brookwood Blvd
- 6746 Sunset Hills Blvd
- 6750 Sunset Hills Blvd
- 6683 Homestead Rd
- 6814 Biscayne
- 6320 Headwaters Way
- 3712 Skyline Place
- 6702 Saganaw Dr
- 0 Lakeland Rd Unit 7648836
- 0 Lakeland Rd Unit 10603417
- 6608 Chesepeake Trail
- 6604 Chesepeake Trail
Your Personal Tour Guide
Ask me questions while you tour the home.