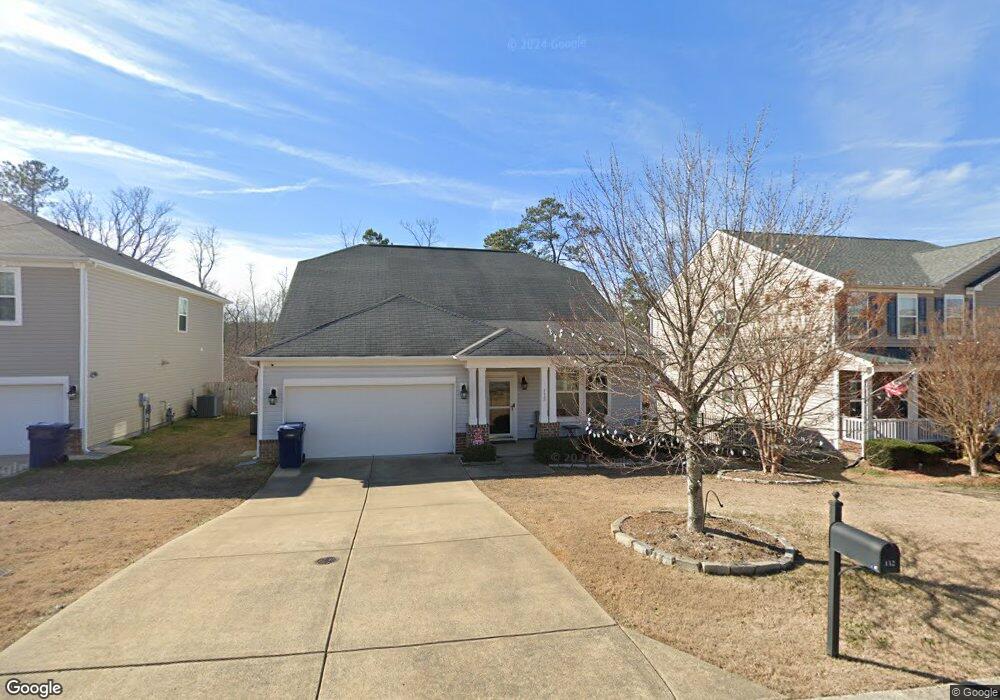
132 Chownings Dr Sanford, NC 27330
Estimated Value: $305,000 - $350,000
3
Beds
3
Baths
1,999
Sq Ft
$165/Sq Ft
Est. Value
About This Home
This home is located at 132 Chownings Dr, Sanford, NC 27330 and is currently estimated at $329,202, approximately $164 per square foot. 132 Chownings Dr is a home located in Lee County with nearby schools including J.R. Ingram Jr. Elementary School, Sanlee Middle School, and Southern Lee High School.
Ownership History
Date
Name
Owned For
Owner Type
Purchase Details
Closed on
Apr 29, 2013
Sold by
Chapman Natasha
Bought by
Bednarcyk Marsha
Current Estimated Value
Purchase Details
Closed on
Dec 29, 2011
Sold by
Bednarcyk Marsha
Bought by
Chapman Natasha
Home Financials for this Owner
Home Financials are based on the most recent Mortgage that was taken out on this home.
Original Mortgage
$76,026
Interest Rate
4.08%
Mortgage Type
Seller Take Back
Purchase Details
Closed on
Dec 9, 2011
Sold by
Beazer Homes Corp
Bought by
Bednareyk Marsha
Home Financials for this Owner
Home Financials are based on the most recent Mortgage that was taken out on this home.
Original Mortgage
$76,026
Interest Rate
4.08%
Mortgage Type
Seller Take Back
Purchase Details
Closed on
Oct 5, 2004
Bought by
Mcblock Properties Llc
Create a Home Valuation Report for This Property
The Home Valuation Report is an in-depth analysis detailing your home's value as well as a comparison with similar homes in the area
Home Values in the Area
Average Home Value in this Area
Purchase History
| Date | Buyer | Sale Price | Title Company |
|---|---|---|---|
| Bednarcyk Marsha | $69,000 | None Available | |
| Chapman Natasha | $77,000 | None Available | |
| Bednareyk Marsha | $155,500 | -- | |
| Mcblock Properties Llc | -- | -- |
Source: Public Records
Mortgage History
| Date | Status | Borrower | Loan Amount |
|---|---|---|---|
| Previous Owner | Chapman Natasha | $76,026 |
Source: Public Records
Tax History Compared to Growth
Tax History
| Year | Tax Paid | Tax Assessment Tax Assessment Total Assessment is a certain percentage of the fair market value that is determined by local assessors to be the total taxable value of land and additions on the property. | Land | Improvement |
|---|---|---|---|---|
| 2025 | $3,775 | $287,300 | $45,000 | $242,300 |
| 2024 | $3,755 | $287,300 | $45,000 | $242,300 |
| 2023 | $3,745 | $287,300 | $45,000 | $242,300 |
| 2022 | $2,585 | $167,800 | $20,000 | $147,800 |
| 2021 | $2,626 | $167,800 | $20,000 | $147,800 |
| 2020 | $2,617 | $167,800 | $20,000 | $147,800 |
| 2019 | $2,577 | $167,800 | $20,000 | $147,800 |
| 2018 | $2,169 | $140,600 | $20,000 | $120,600 |
| 2017 | $2,142 | $137,400 | $20,000 | $117,400 |
| 2016 | $2,117 | $137,400 | $20,000 | $117,400 |
| 2014 | $2,014 | $137,400 | $20,000 | $117,400 |
Source: Public Records
Map
Nearby Homes
- 200 Quartermaster
- 208 Chandler Ct
- Oriole Plan at Westford
- Raven Plan at Westford
- Rosella Plan at Westford
- Starling Plan at Westford
- Whimbrel Plan at Westford
- Ibis Plan at Westford
- 100 Chandler Ct
- 908 Merchants Ct
- 339 Scottsdale Dr
- 348 Scottsdale Dr
- 725 Richardson Dr
- 729 Golden Horseshoe Ln
- 100 Tower Ridge Ln
- 616 Britton Ct
- 1718 Carthage St
- 384 Scottsdale Dr
- 745 Richardson Dr
- 113 Tower Ridge Ln
- 130 Chownings Dr
- 134 Chownings Dr
- 136 Chownings Dr
- 138 Chownings Dr
- 126 Chownings Dr
- 907 Golden Horseshoe Ln
- 133 Chownings Dr
- 135 Chownings Dr
- 124 Chownings Dr
- 137 Chownings Dr
- 140 Chownings Dr
- 903 Golden Horseshoe Ln
- 122 Chownings Dr
- 908 Golden Horseshoe Ln
- 209 Chownings Dr
- 202 Quartermaster
- 904 Golden Horseshoe Ln
- 204 Quartermaster Dr
- 120 Chownings Dr
- 206 Quartermaster Dr