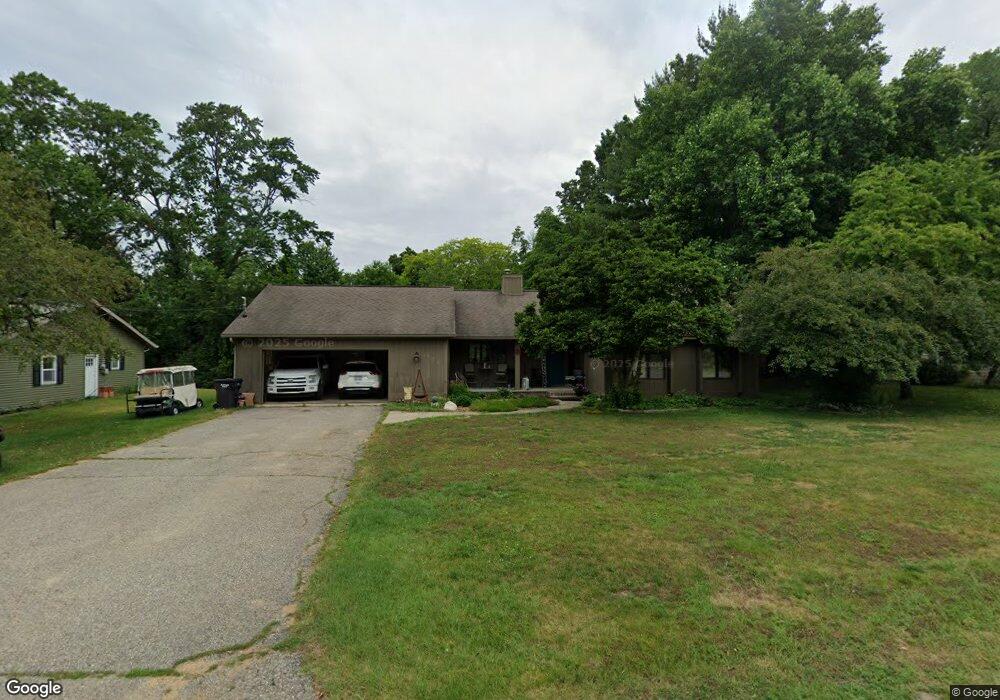
132 Circle Dr Allegan, MI 49010
Estimated Value: $262,544 - $297,000
--
Bed
2
Baths
1,584
Sq Ft
$175/Sq Ft
Est. Value
About This Home
This home is located at 132 Circle Dr, Allegan, MI 49010 and is currently estimated at $277,136, approximately $174 per square foot. 132 Circle Dr is a home located in Allegan County with nearby schools including West Ward Elementary School, L.E. White Middle School, and Allegan High School.
Ownership History
Date
Name
Owned For
Owner Type
Purchase Details
Closed on
Aug 2, 2017
Sold by
The Joseph C & Eleanor H Hooker Restated
Bought by
Visuri Amy Lynn
Current Estimated Value
Purchase Details
Closed on
Jan 21, 2011
Sold by
Hooker Eleanor H
Bought by
Hooker Eleanor H
Purchase Details
Closed on
Nov 30, 2004
Sold by
Hooker Eleanor H
Bought by
Hooker Eleanor H
Purchase Details
Closed on
Aug 23, 2001
Sold by
Hooker Eleanor
Bought by
Hooker Eleanor H
Create a Home Valuation Report for This Property
The Home Valuation Report is an in-depth analysis detailing your home's value as well as a comparison with similar homes in the area
Home Values in the Area
Average Home Value in this Area
Purchase History
| Date | Buyer | Sale Price | Title Company |
|---|---|---|---|
| Visuri Amy Lynn | $60,000 | Chicago Title Of Mi Inc | |
| Hooker Eleanor H | -- | None Available | |
| Hooker Eleanor H | -- | None Available | |
| Hooker Eleanor H | -- | -- | |
| Hooker Eleanor H | -- | -- |
Source: Public Records
Tax History Compared to Growth
Tax History
| Year | Tax Paid | Tax Assessment Tax Assessment Total Assessment is a certain percentage of the fair market value that is determined by local assessors to be the total taxable value of land and additions on the property. | Land | Improvement |
|---|---|---|---|---|
| 2025 | $3,536 | $141,100 | $19,600 | $121,500 |
| 2024 | $3,218 | $122,400 | $17,000 | $105,400 |
| 2023 | $3,334 | $106,200 | $16,200 | $90,000 |
| 2022 | $3,218 | $94,200 | $13,400 | $80,800 |
| 2021 | $3,076 | $89,900 | $10,600 | $79,300 |
| 2020 | $3,032 | $80,300 | $9,800 | $70,500 |
| 2019 | $2,957 | $71,900 | $9,900 | $62,000 |
| 2018 | $2,682 | $65,400 | $9,700 | $55,700 |
| 2017 | $0 | $60,800 | $8,100 | $52,700 |
| 2016 | $0 | $50,200 | $6,700 | $43,500 |
| 2015 | -- | $50,200 | $6,700 | $43,500 |
| 2014 | -- | $52,300 | $6,700 | $45,600 |
| 2013 | $3,045 | $54,400 | $6,700 | $47,700 |
Source: Public Records
Map
Nearby Homes