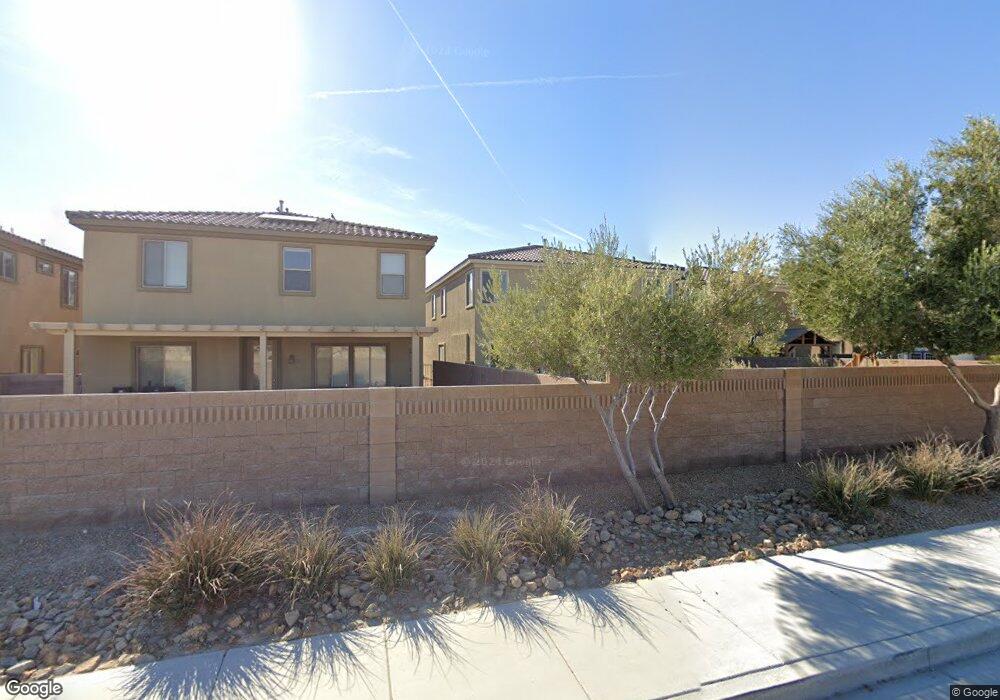
132 Delighted Ave North Las Vegas, NV 89031
Craig Ranch NeighborhoodEstimated Value: $486,604 - $554,000
3
Beds
3
Baths
3,036
Sq Ft
$176/Sq Ft
Est. Value
About This Home
This home is located at 132 Delighted Ave, North Las Vegas, NV 89031 and is currently estimated at $534,151, approximately $175 per square foot. 132 Delighted Ave is a home located in Clark County with nearby schools including Don E. Hayden Elementary School, Ruby Duncan Elementary School, and Brian & Teri Cram Middle School.
Ownership History
Date
Name
Owned For
Owner Type
Purchase Details
Closed on
Sep 23, 2021
Sold by
Cunningham Sean and Cunningham Shelly
Bought by
Cunningham Sean
Current Estimated Value
Home Financials for this Owner
Home Financials are based on the most recent Mortgage that was taken out on this home.
Original Mortgage
$216,000
Outstanding Balance
$196,544
Interest Rate
2.8%
Mortgage Type
New Conventional
Estimated Equity
$337,607
Purchase Details
Closed on
Nov 22, 2011
Sold by
Rugged Oaks Investments Llc
Bought by
Cunningham Sean and Cunningham Shelly
Purchase Details
Closed on
Sep 16, 2011
Sold by
Us Financial Group Llc
Bought by
Rugged Oaks Investments Llc
Purchase Details
Closed on
Nov 21, 2008
Sold by
Us Financial Group Llc
Bought by
Moshoshaumo Llc Series 132 Delighted
Purchase Details
Closed on
Jul 19, 2007
Sold by
Standard Pacific Of Las Vegas Inc
Bought by
Us Financial Group Llc
Home Financials for this Owner
Home Financials are based on the most recent Mortgage that was taken out on this home.
Original Mortgage
$2,236,350
Interest Rate
6.17%
Mortgage Type
Unknown
Create a Home Valuation Report for This Property
The Home Valuation Report is an in-depth analysis detailing your home's value as well as a comparison with similar homes in the area
Home Values in the Area
Average Home Value in this Area
Purchase History
| Date | Buyer | Sale Price | Title Company |
|---|---|---|---|
| Cunningham Sean | -- | Solidifi Title Agency Ltd | |
| Cunningham Sean | $140,000 | Nevada Title Las Vegas | |
| Rugged Oaks Investments Llc | $1,618,551 | Fidelity National Title T | |
| Moshoshaumo Llc Series 132 Delighted | -- | None Available | |
| Us Financial Group Llc | $5,382,355 | First Amer Title Co Of Nv |
Source: Public Records
Mortgage History
| Date | Status | Borrower | Loan Amount |
|---|---|---|---|
| Open | Cunningham Sean | $216,000 | |
| Previous Owner | Us Financial Group Llc | $2,236,350 |
Source: Public Records
Tax History Compared to Growth
Tax History
| Year | Tax Paid | Tax Assessment Tax Assessment Total Assessment is a certain percentage of the fair market value that is determined by local assessors to be the total taxable value of land and additions on the property. | Land | Improvement |
|---|---|---|---|---|
| 2025 | $2,870 | $154,959 | $42,700 | $112,259 |
| 2024 | $2,658 | $154,959 | $42,700 | $112,259 |
| 2023 | $2,658 | $155,982 | $38,500 | $117,482 |
| 2022 | $2,461 | $122,783 | $29,750 | $93,033 |
| 2021 | $2,279 | $109,507 | $28,350 | $81,157 |
| 2020 | $2,113 | $103,146 | $25,900 | $77,246 |
| 2019 | $1,981 | $98,511 | $23,450 | $75,061 |
| 2018 | $1,890 | $90,708 | $19,250 | $71,458 |
| 2017 | $2,843 | $84,761 | $17,500 | $67,261 |
| 2016 | $1,762 | $74,050 | $15,400 | $58,650 |
| 2015 | $1,758 | $61,234 | $11,900 | $49,334 |
| 2014 | $1,703 | $49,266 | $8,750 | $40,516 |
Source: Public Records
Map
Nearby Homes
- 117 Barton Bay Ave
- 217 Delighted Ave
- 220 Vegas Verde Ave Unit LOT 4
- 232 Delighted Ave
- 213 Vegas Verde Ave
- 213 Vegas Verde Ave Unit LOT 25
- 228 Vegas Verde Ave Unit LOT 2
- 221 Vegas Verde Ave Unit 27
- 232 Vegas Verde Ave Unit LOT 1
- 104 Barton Bay Ave
- 6212 Corleone Ct Unit LOT 28
- 2436 Plan at Sky Falls
- 2660 Plan at Sky Falls
- 2160 Plan at Sky Falls
- 3000 Plan at Sky Falls
- 62 Barton Bay Ave
- 71 Gosia Grove Ave
- 301 Mindoro Ave
- 47 Barton Bay Ave
- 6353 Cuen Cove St
- 128 Delighted Ave
- 128 Delighted Ave Unit na
- 136 Delighted Ave
- 136 Delighted Ave Unit n/a
- 204 Delighted Ave
- 124 Delighted Ave
- 208 Delighted Ave
- 120 Delighted Ave
- 129 Delighted Ave
- 133 Delighted Ave
- 125 Delighted Ave
- 121 Delighted Ave
- 212 Delighted Ave
- 137 Delighted Ave
- 125 Barton Bay Ave
- 205 Delighted Ave
- 205 Delighted Ave Unit na
- 121 Barton Bay Ave
- 209 Delighted Ave
- 216 Delighted Ave