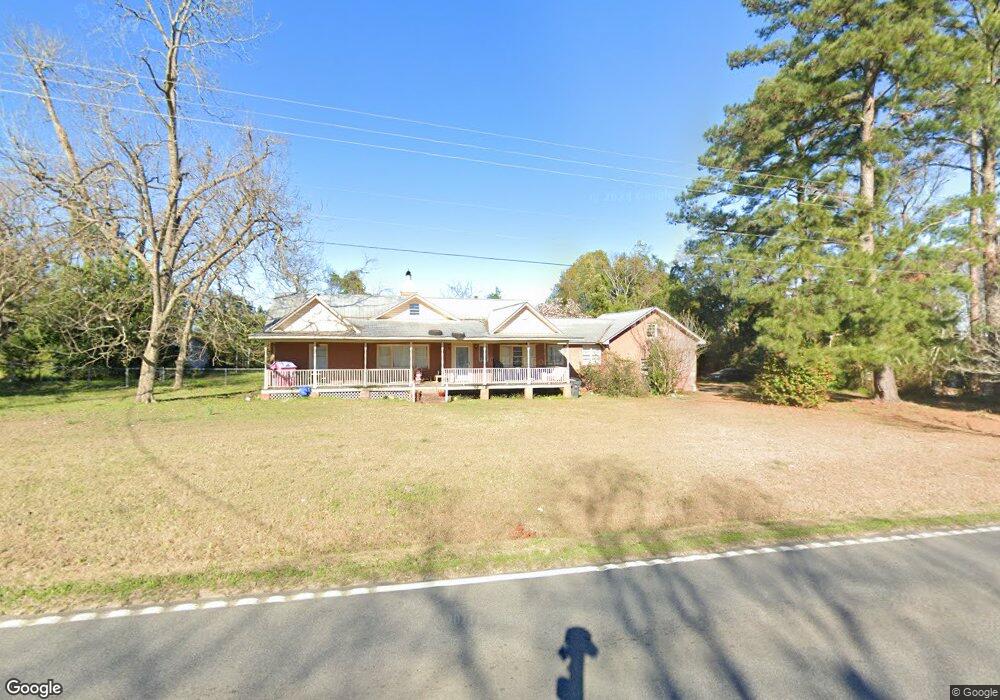
132 E Mulberry St Moultrie, GA 31768
Estimated Value: $178,350 - $243,000
--
Bed
2
Baths
2,141
Sq Ft
$104/Sq Ft
Est. Value
About This Home
This home is located at 132 E Mulberry St, Moultrie, GA 31768 and is currently estimated at $222,338, approximately $103 per square foot. 132 E Mulberry St is a home located in Colquitt County with nearby schools including Funston Elementary School, C.A. Gray Junior High School, and Willie J. Williams Middle School.
Ownership History
Date
Name
Owned For
Owner Type
Purchase Details
Closed on
Jul 30, 2022
Sold by
Guemez Luciano
Bought by
Guemez Luciano
Current Estimated Value
Home Financials for this Owner
Home Financials are based on the most recent Mortgage that was taken out on this home.
Original Mortgage
$129,222
Outstanding Balance
$123,283
Interest Rate
5.25%
Mortgage Type
FHA
Estimated Equity
$99,055
Purchase Details
Closed on
Apr 19, 2017
Bought by
Guemez Luciano
Home Financials for this Owner
Home Financials are based on the most recent Mortgage that was taken out on this home.
Original Mortgage
$88,369
Interest Rate
4.25%
Mortgage Type
FHA
Purchase Details
Closed on
Oct 6, 2015
Sold by
Strickland Gary S
Bought by
Southwest Georgia Bank
Purchase Details
Closed on
Jun 8, 2000
Sold by
Culpepper Jerry Etal
Bought by
Strickland Gary S
Purchase Details
Closed on
Apr 25, 1988
Bought by
Culpepper Jack
Create a Home Valuation Report for This Property
The Home Valuation Report is an in-depth analysis detailing your home's value as well as a comparison with similar homes in the area
Home Values in the Area
Average Home Value in this Area
Purchase History
| Date | Buyer | Sale Price | Title Company |
|---|---|---|---|
| Guemez Luciano | $15,000 | -- | |
| Guemez Luciano | $90,000 | -- | |
| Southwest Georgia Bank | -- | -- | |
| Strickland Gary S | $52,500 | -- | |
| Culpepper Jack | -- | -- |
Source: Public Records
Mortgage History
| Date | Status | Borrower | Loan Amount |
|---|---|---|---|
| Open | Guemez Luciano | $129,222 | |
| Previous Owner | Guemez Luciano | $88,369 |
Source: Public Records
Tax History Compared to Growth
Tax History
| Year | Tax Paid | Tax Assessment Tax Assessment Total Assessment is a certain percentage of the fair market value that is determined by local assessors to be the total taxable value of land and additions on the property. | Land | Improvement |
|---|---|---|---|---|
| 2024 | $2,378 | $76,469 | $1,460 | $75,009 |
| 2023 | $1,797 | $62,972 | $1,460 | $61,512 |
| 2022 | $1,334 | $50,170 | $1,460 | $48,710 |
| 2021 | $1,209 | $44,777 | $1,460 | $43,317 |
| 2020 | $1,133 | $41,083 | $1,460 | $39,623 |
| 2019 | $1,180 | $38,867 | $1,460 | $37,407 |
| 2018 | $1,170 | $38,867 | $1,460 | $37,407 |
| 2017 | $939 | $31,475 | $1,460 | $30,015 |
| 2016 | $946 | $31,475 | $1,460 | $30,015 |
| 2015 | $798 | $28,458 | $1,460 | $26,998 |
| 2014 | $824 | $28,458 | $1,460 | $26,998 |
| 2013 | -- | $28,458 | $1,460 | $26,998 |
Source: Public Records
Map
Nearby Homes
- 0 Fox Trot Dr
- LOT 30 Merganser Ln
- LOT 23 Westwoods Dr
- 198 Westwoods Dr
- 372 Westwoods Dr Unit 21
- 00 Rossman Dairy Rd
- 2393 Georgia 37
- 219 Cox Dairy Rd
- 1791 Funston Sigsbee Rd
- 102 Schley Church Rd
- 0 Kendallwood Dr Unit 1652301
- 216 Circle Rd
- 1485 Bay Rd
- 1321 Hallmark Dr
- 410 West Bypass NW
- 410 W Bypass Pass NW
- 722 Martin Luther King jr Dr
- 417 9th St NW
- 2010 West Blvd
- 107 30th Ave NW
- 118 E Mulberry St
- 148 E Mulberry St
- 123 E Mulberry St
- 159 E Mulberry St
- 156 E Mulberry St
- 113 E Mulberry St
- 149 E Mulberry St
- 162 E Mulberry St
- 132 S Manning St
- 170 E Mulberry St
- 123 N Manning St
- 136 N Manning St
- 127 S Manning St
- 114 S Academy St SW
- 120 W Mulberry St
- 131 N Manning St
- 150 N Manning St
- 116 Academy St NW
- 173 E Mulberry St
- 137 N Manning St