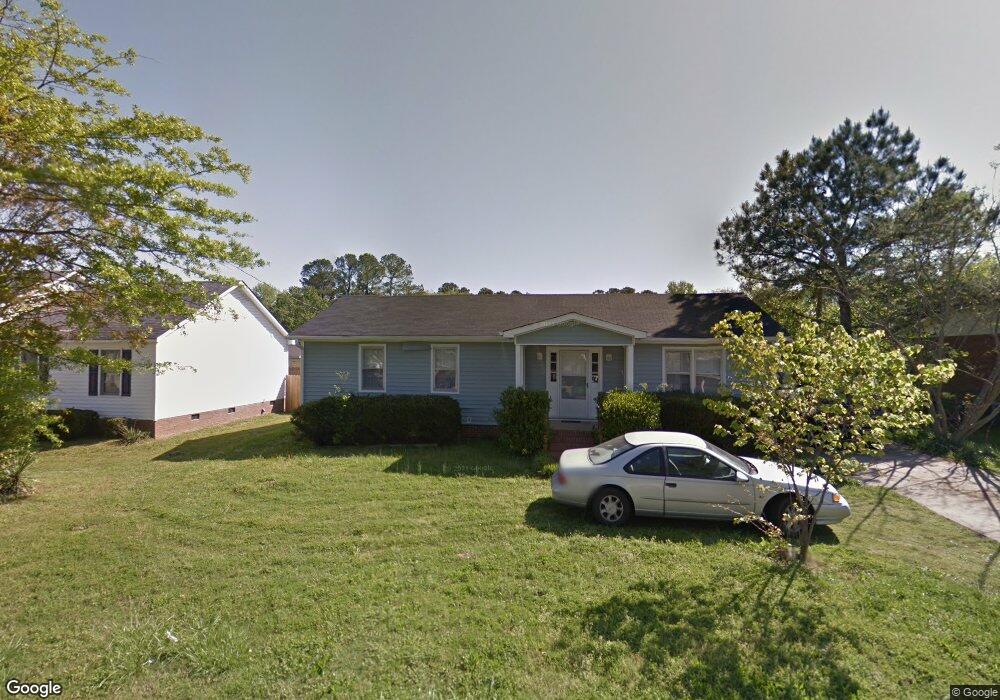
132 E Ridge Cir Clayton, NC 27520
Estimated Value: $244,801 - $257,000
3
Beds
2
Baths
1,194
Sq Ft
$212/Sq Ft
Est. Value
About This Home
This home is located at 132 E Ridge Cir, Clayton, NC 27520 and is currently estimated at $252,950, approximately $211 per square foot. 132 E Ridge Cir is a home located in Johnston County with nearby schools including Cooper Academy, Riverwood Middle School, and Clayton High.
Ownership History
Date
Name
Owned For
Owner Type
Purchase Details
Closed on
Aug 17, 2020
Sold by
Gonzales Joseph Y and Gonzlaes Lauren A
Bought by
Mitchell Tavis
Current Estimated Value
Home Financials for this Owner
Home Financials are based on the most recent Mortgage that was taken out on this home.
Original Mortgage
$171,731
Outstanding Balance
$152,337
Interest Rate
3%
Estimated Equity
$100,613
Purchase Details
Closed on
Sep 24, 2015
Sold by
Jimenez Ricardo and Jimenez Celia Roxana
Bought by
Gonzales Lauren A and Gonzales Joseph Y
Home Financials for this Owner
Home Financials are based on the most recent Mortgage that was taken out on this home.
Original Mortgage
$90,700
Interest Rate
4.25%
Mortgage Type
Adjustable Rate Mortgage/ARM
Purchase Details
Closed on
Jun 16, 2006
Sold by
Federal National Mortgage Association
Bought by
Jimenez Ricardo and Jimenez Celia Roxana
Purchase Details
Closed on
Mar 20, 2006
Sold by
Gaddis Shirley Artis and Gaddis Larry W
Bought by
Federal National Mortgage Association
Create a Home Valuation Report for This Property
The Home Valuation Report is an in-depth analysis detailing your home's value as well as a comparison with similar homes in the area
Home Values in the Area
Average Home Value in this Area
Purchase History
We collect this data history from publicly available records. To have your information removed, we recommend requesting removal directly through your county’s website.
| Date | Buyer | Sale Price | Title Company |
|---|---|---|---|
| Mitchell Tavis | $175,000 | None Available | |
| Gonzales Lauren A | $91,000 | None Available | |
| Jimenez Ricardo | -- | None Available | |
| Federal National Mortgage Association | $75,895 | None Available |
Source: Public Records
Mortgage History
We collect this data history from publicly available records. To have your information removed, we recommend requesting removal directly through your county’s website.
| Date | Status | Borrower | Loan Amount |
|---|---|---|---|
| Open | Mitchell Tavis | $171,731 | |
| Previous Owner | Gonzales Lauren A | $90,700 |
Source: Public Records
Tax History
| Year | Tax Paid | Tax Assessment Tax Assessment Total Assessment is a certain percentage of the fair market value that is determined by local assessors to be the total taxable value of land and additions on the property. | Land | Improvement |
|---|---|---|---|---|
| 2025 | $2,458 | $243,320 | $75,000 | $168,320 |
| 2024 | $1,672 | $126,670 | $42,000 | $84,670 |
| 2023 | $1,634 | $126,670 | $42,000 | $84,670 |
| 2022 | $1,685 | $126,670 | $42,000 | $84,670 |
| 2021 | $1,659 | $126,670 | $42,000 | $84,670 |
| 2020 | $1,524 | $113,710 | $42,000 | $71,710 |
| 2019 | $1,524 | $113,710 | $42,000 | $71,710 |
| 2018 | $1,261 | $92,730 | $25,000 | $67,730 |
| 2017 | $1,233 | $92,730 | $25,000 | $67,730 |
| 2016 | $1,233 | $92,730 | $25,000 | $67,730 |
| 2015 | $1,210 | $92,730 | $25,000 | $67,730 |
| 2014 | $1,210 | $92,730 | $25,000 | $67,730 |
Source: Public Records
Map
Nearby Homes
- 177 Buckhorn Branch Park
- 114 Buckhorn Branch Park
- 82 Buckhorn Branch Park
- 205 Buckhorn Branch Park
- 0 Washington and Smith St
- 546 E Front St
- 0 Washington St Unit 10147077
- 01 Washington St
- 17 Watauga Way
- 330 E Stallings St
- 420 Cooper St
- 368 Village Walk Dr
- 339 Village Walk Dr
- 356 Village Walk Dr
- 400 E Hinton St
- 331 Village Walk Dr
- 902 E Main St
- 344 Village Walk Dr
- 59 Watauga Way
- 69 Watauga Way
- 253 Buckhorn Branch Park
- 146 Buckhorn Branch Park Unit 12
- 173 Buckhorn Branch Park Unit 158
- 90 Buckhorn Branch Park Unit 7
- 170 Buckhorn Branch Park Unit 15
- 100 Buckhorn Branch Park Unit 8
- 169 Buckhorn Branch Park Unit 159
- 74 Buckhorn Branch Park Unit 5
- 177 Buckhorn Branch Park Unit 157
- 164 Buckhorn Branch Park Unit 14
- 82 Buckhorn Branch Park Unit 6
- 126 Buckhorn Branch Park Unit 10
- 261 Buckhorn Branch Park Unit 147
- 158 Buckhorn Branch Park Unit 13
- 114 Buckhorn Branch Park Unit 9
- 217 Buckhorn Branch Park Unit 152
- 191 Buckhorn Branch Park Unit 155
- 205 Buckhorn Branch Park Unit 154
- 238 Buckhorn Branch Park Unit 31
- 181 Buckhorn Branch Park Unit 156
Your Personal Tour Guide
Ask me questions while you tour the home.