Estimated Value: $394,000 - $549,000
3
Beds
2
Baths
2,205
Sq Ft
$204/Sq Ft
Est. Value
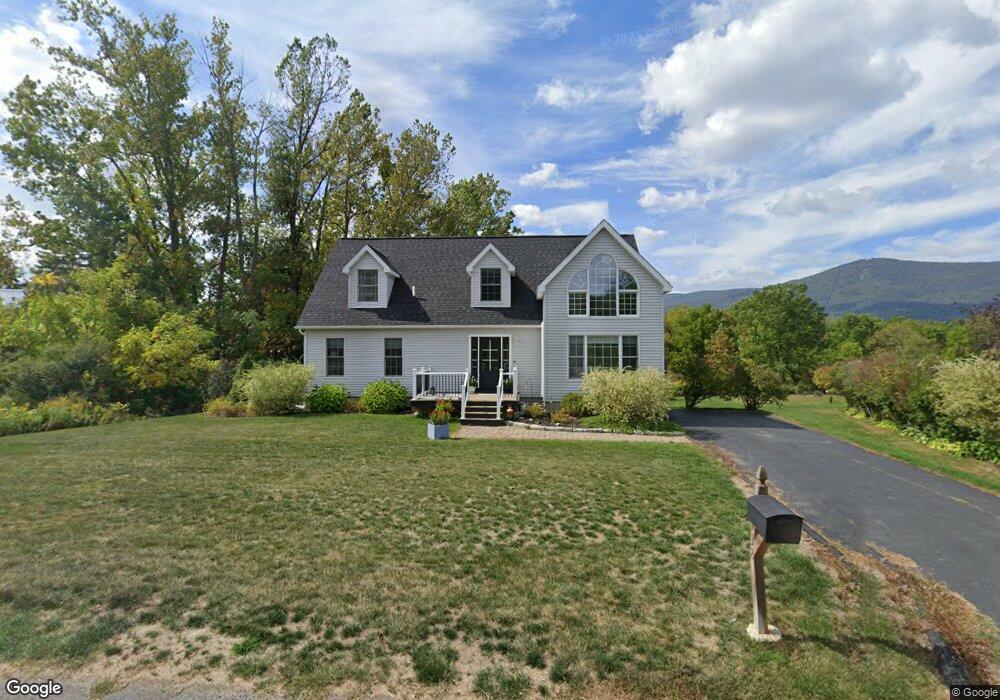
About This Home
This home is located at 132 East Rd, Adams, MA 01220 and is currently estimated at $450,692, approximately $204 per square foot. 132 East Rd is a home located in Berkshire County with nearby schools including Hoosac Valley Middle & High School, Berkshire Arts & Technology Charter Public School, and St. Stanislaus Kostka School.
Ownership History
Date
Name
Owned For
Owner Type
Purchase Details
Closed on
Mar 2, 2007
Sold by
Keating John H and Keating Joyce A
Bought by
Munger Steven L
Current Estimated Value
Home Financials for this Owner
Home Financials are based on the most recent Mortgage that was taken out on this home.
Original Mortgage
$261,250
Outstanding Balance
$156,643
Interest Rate
6.27%
Mortgage Type
Purchase Money Mortgage
Estimated Equity
$294,049
Purchase Details
Closed on
Aug 1, 2003
Sold by
Stohlmann Arthur J
Bought by
Keating John H
Home Financials for this Owner
Home Financials are based on the most recent Mortgage that was taken out on this home.
Original Mortgage
$48,000
Interest Rate
5.28%
Mortgage Type
Purchase Money Mortgage
Create a Home Valuation Report for This Property
The Home Valuation Report is an in-depth analysis detailing your home's value as well as a comparison with similar homes in the area
Home Values in the Area
Average Home Value in this Area
Purchase History
We collect this data history from publicly available records. To have your information removed, we recommend requesting removal directly through your county’s website.
| Date | Buyer | Sale Price | Title Company |
|---|---|---|---|
| Munger Steven L | $275,000 | -- | |
| Keating John H | $38,000 | -- |
Source: Public Records
Mortgage History
We collect this data history from publicly available records. To have your information removed, we recommend requesting removal directly through your county’s website.
| Date | Status | Borrower | Loan Amount |
|---|---|---|---|
| Open | Munger Steven L | $261,250 | |
| Previous Owner | Keating John H | $48,000 |
Source: Public Records
Tax History
| Year | Tax Paid | Tax Assessment Tax Assessment Total Assessment is a certain percentage of the fair market value that is determined by local assessors to be the total taxable value of land and additions on the property. | Land | Improvement |
|---|---|---|---|---|
| 2025 | $6,537 | $384,300 | $55,900 | $328,400 |
| 2024 | $6,143 | $350,200 | $52,600 | $297,600 |
| 2023 | $5,628 | $303,400 | $47,800 | $255,600 |
| 2022 | $5,473 | $262,000 | $41,600 | $220,400 |
| 2021 | $5,289 | $233,800 | $41,600 | $192,200 |
| 2020 | $5,083 | $232,300 | $42,100 | $190,200 |
| 2019 | $4,969 | $232,300 | $42,100 | $190,200 |
| 2018 | $5,128 | $230,900 | $42,100 | $188,800 |
| 2017 | $4,934 | $230,900 | $42,100 | $188,800 |
| 2016 | $4,708 | $220,100 | $42,100 | $178,000 |
| 2015 | $4,676 | $218,800 | $44,000 | $174,800 |
| 2014 | $4,365 | $218,800 | $44,000 | $174,800 |
Source: Public Records
Map
Nearby Homes
Your Personal Tour Guide
Ask me questions while you tour the home.