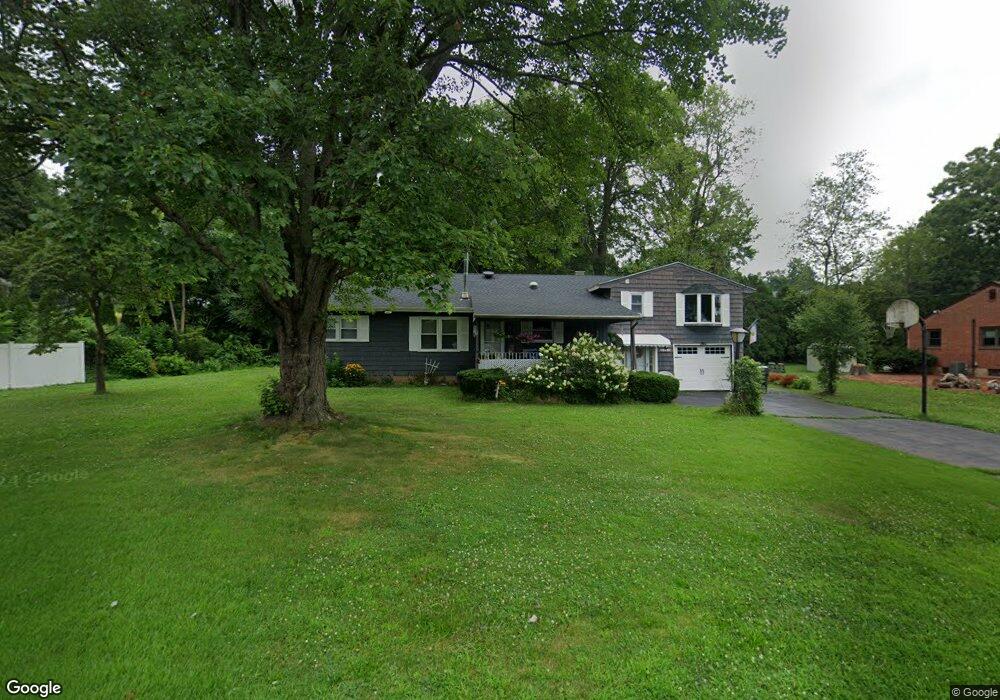
132 Edward St Newington, CT 06111
Estimated Value: $397,000 - $415,000
2
Beds
2
Baths
1,644
Sq Ft
$246/Sq Ft
Est. Value
About This Home
This home is located at 132 Edward St, Newington, CT 06111 and is currently estimated at $404,884, approximately $246 per square foot. 132 Edward St is a home located in Hartford County with nearby schools including John Paterson School, John Wallace Middle School, and Newington High School.
Ownership History
Date
Name
Owned For
Owner Type
Purchase Details
Closed on
Feb 6, 2002
Sold by
Dipierro Ann M
Bought by
Cosella Robin A
Current Estimated Value
Purchase Details
Closed on
Dec 4, 2000
Sold by
Casella Robin A
Bought by
Dipierro Ann M
Purchase Details
Closed on
Jun 25, 1999
Sold by
Rossignol Theresa R
Bought by
Casella Robin A and Dipierro Ann M
Home Financials for this Owner
Home Financials are based on the most recent Mortgage that was taken out on this home.
Original Mortgage
$120,000
Interest Rate
6.05%
Create a Home Valuation Report for This Property
The Home Valuation Report is an in-depth analysis detailing your home's value as well as a comparison with similar homes in the area
Home Values in the Area
Average Home Value in this Area
Purchase History
| Date | Buyer | Sale Price | Title Company |
|---|---|---|---|
| Cosella Robin A | $27,000 | -- | |
| Dipierro Ann M | $3,000 | -- | |
| Casella Robin A | $152,000 | -- |
Source: Public Records
Mortgage History
| Date | Status | Borrower | Loan Amount |
|---|---|---|---|
| Closed | Casella Robin A | $0 | |
| Closed | Casella Robin A | $111,000 | |
| Closed | Casella Robin A | $113,000 | |
| Previous Owner | Casella Robin A | $120,000 |
Source: Public Records
Tax History Compared to Growth
Tax History
| Year | Tax Paid | Tax Assessment Tax Assessment Total Assessment is a certain percentage of the fair market value that is determined by local assessors to be the total taxable value of land and additions on the property. | Land | Improvement |
|---|---|---|---|---|
| 2025 | $6,441 | $161,100 | $56,230 | $104,870 |
| 2024 | $6,391 | $161,100 | $56,230 | $104,870 |
| 2023 | $6,180 | $161,100 | $56,230 | $104,870 |
| 2022 | $6,201 | $161,100 | $56,230 | $104,870 |
| 2021 | $6,252 | $161,100 | $56,230 | $104,870 |
| 2020 | $6,230 | $158,600 | $56,230 | $102,370 |
| 2019 | $6,257 | $158,600 | $56,230 | $102,370 |
| 2018 | $6,106 | $158,600 | $56,230 | $102,370 |
| 2017 | $5,803 | $158,600 | $56,230 | $102,370 |
| 2016 | $5,670 | $158,600 | $56,230 | $102,370 |
| 2014 | $5,607 | $161,260 | $56,060 | $105,200 |
Source: Public Records
Map
Nearby Homes