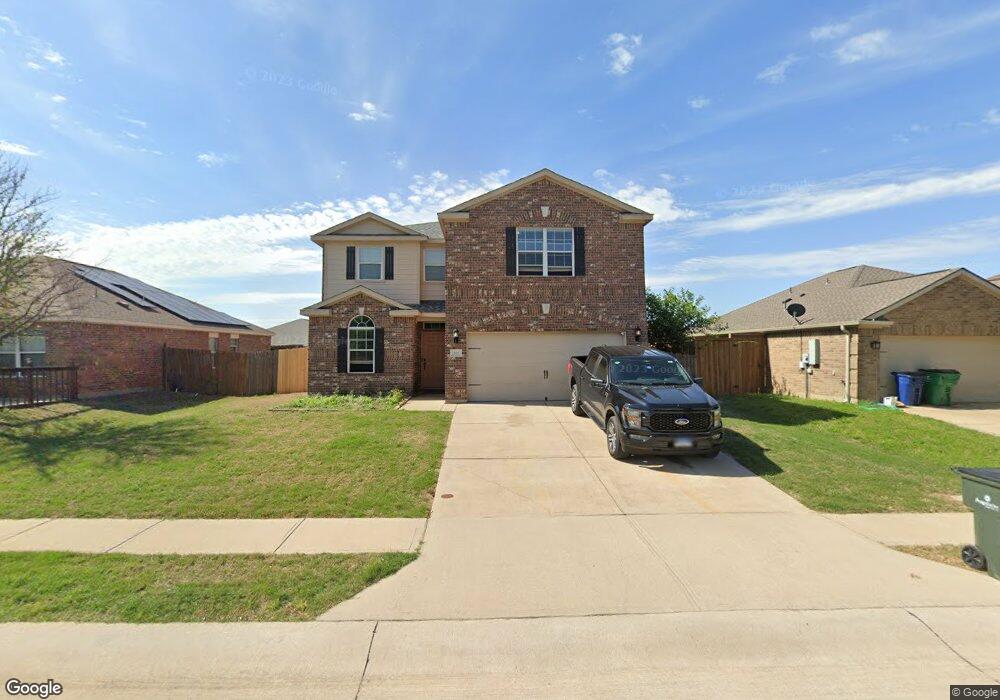
132 Eider Dr Sanger, TX 76266
Estimated Value: $316,696 - $378,000
5
Beds
3
Baths
2,700
Sq Ft
$132/Sq Ft
Est. Value
About This Home
This home is located at 132 Eider Dr, Sanger, TX 76266 and is currently estimated at $356,174, approximately $131 per square foot. 132 Eider Dr is a home located in Denton County with nearby schools including Chisholm Trail Elementary School, Clear Creek Intermediate School, and Sanger Sixth Grade Campus.
Ownership History
Date
Name
Owned For
Owner Type
Purchase Details
Closed on
May 22, 2019
Sold by
Koirala Kushal and Koirala Jennifer S
Bought by
Koebrick Ronald and Koebrick Brooke
Current Estimated Value
Home Financials for this Owner
Home Financials are based on the most recent Mortgage that was taken out on this home.
Original Mortgage
$245,454
Outstanding Balance
$215,365
Interest Rate
4.1%
Mortgage Type
USDA
Estimated Equity
$140,809
Purchase Details
Closed on
Feb 22, 2016
Sold by
Wilbanks Nicole
Bought by
Koirala Kushal
Home Financials for this Owner
Home Financials are based on the most recent Mortgage that was taken out on this home.
Original Mortgage
$182,400
Interest Rate
3.92%
Mortgage Type
New Conventional
Purchase Details
Closed on
Oct 22, 2012
Sold by
Lgi Homes Quail Run Llc
Bought by
Wilbanks Nicole
Home Financials for this Owner
Home Financials are based on the most recent Mortgage that was taken out on this home.
Original Mortgage
$178,469
Interest Rate
3.59%
Mortgage Type
New Conventional
Create a Home Valuation Report for This Property
The Home Valuation Report is an in-depth analysis detailing your home's value as well as a comparison with similar homes in the area
Home Values in the Area
Average Home Value in this Area
Purchase History
| Date | Buyer | Sale Price | Title Company |
|---|---|---|---|
| Koebrick Ronald | -- | Providence Title Company | |
| Koirala Kushal | -- | Freedom Title | |
| Wilbanks Nicole | -- | Texas American Title Company |
Source: Public Records
Mortgage History
| Date | Status | Borrower | Loan Amount |
|---|---|---|---|
| Open | Koebrick Ronald | $245,454 | |
| Previous Owner | Koirala Kushal | $182,400 | |
| Previous Owner | Wilbanks Nicole | $178,469 |
Source: Public Records
Tax History
| Year | Tax Paid | Tax Assessment Tax Assessment Total Assessment is a certain percentage of the fair market value that is determined by local assessors to be the total taxable value of land and additions on the property. | Land | Improvement |
|---|---|---|---|---|
| 2025 | $5,555 | $327,519 | $69,300 | $258,219 |
| 2024 | $6,707 | $331,886 | $69,300 | $262,586 |
| 2023 | $5,249 | $341,609 | $56,700 | $284,909 |
| 2022 | $6,628 | $298,862 | $56,700 | $242,162 |
| 2021 | $5,491 | $261,240 | $45,675 | $215,565 |
| 2020 | $5,382 | $243,224 | $38,493 | $204,731 |
| 2019 | $5,483 | $240,808 | $38,493 | $202,315 |
| 2018 | $5,216 | $227,867 | $38,493 | $198,470 |
| 2017 | $4,764 | $207,152 | $38,493 | $168,659 |
| 2016 | $4,522 | $196,614 | $38,493 | $158,121 |
| 2015 | $4,249 | $181,386 | $24,192 | $157,194 |
| 2013 | -- | $194,410 | $24,192 | $170,218 |
Source: Public Records
Map
Nearby Homes
- 136 Eider Dr
- 124 Morning Glory
- 113 Kincaid Dr
- 140 Ringneck Dr
- 188 Aster Dr
- 185 Aster Dr
- 921 First St
- 307 Quail Crossing Dr
- 1012 Cowling Rd
- 319 Quail Crossing Dr
- 117 Teal Rd
- 226 Hillcrest St
- 0000 Rector Rd
- 113 Diane Dr
- 505 Houston St
- 117 Kathryn Dr
- TBD Railroad Ave
- 2000 S Stemmons St
- 2004 S Stemmons St
- TBD Church St
Your Personal Tour Guide
Ask me questions while you tour the home.