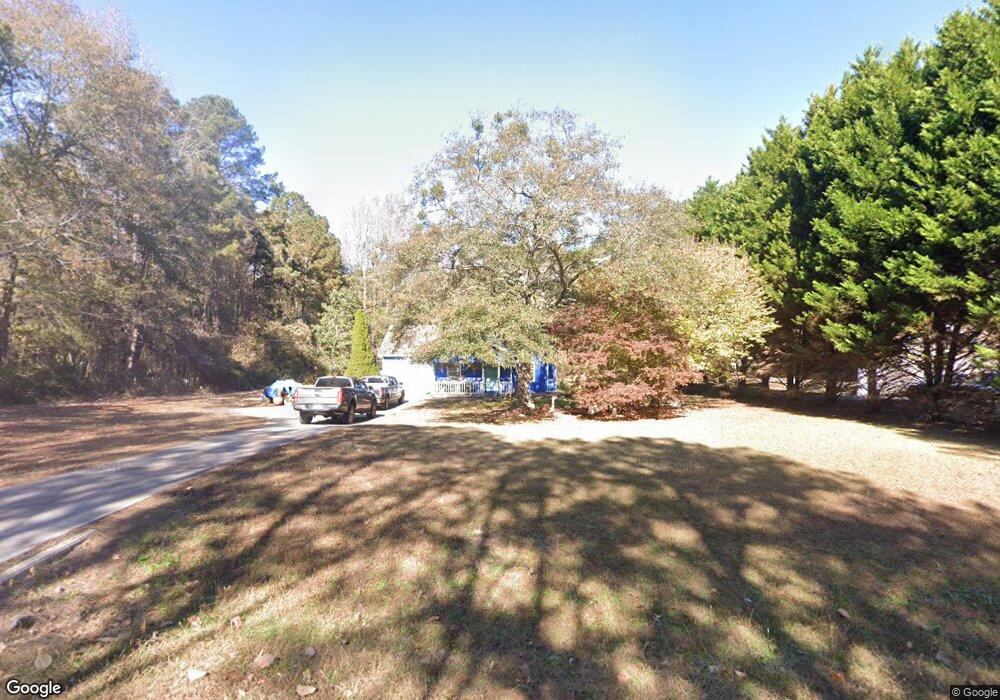
132 Emory Phillips Rd Sharpsburg, GA 30277
Estimated Value: $236,000 - $251,000
3
Beds
2
Baths
1,107
Sq Ft
$218/Sq Ft
Est. Value
About This Home
This home is located at 132 Emory Phillips Rd, Sharpsburg, GA 30277 and is currently estimated at $240,902, approximately $217 per square foot. 132 Emory Phillips Rd is a home located in Coweta County with nearby schools including Willis Road Elementary School, Lee Middle School, and East Coweta High School.
Ownership History
Date
Name
Owned For
Owner Type
Purchase Details
Closed on
Aug 1, 2001
Sold by
Massey Philip L
Bought by
Simolari Michelle and Simolari James K
Current Estimated Value
Home Financials for this Owner
Home Financials are based on the most recent Mortgage that was taken out on this home.
Original Mortgage
$91,500
Outstanding Balance
$35,134
Interest Rate
7.09%
Mortgage Type
New Conventional
Estimated Equity
$205,768
Purchase Details
Closed on
Dec 16, 1998
Sold by
Neece Charles D
Bought by
Massey Phillip L
Home Financials for this Owner
Home Financials are based on the most recent Mortgage that was taken out on this home.
Original Mortgage
$65,600
Interest Rate
6.77%
Mortgage Type
New Conventional
Purchase Details
Closed on
May 24, 1993
Bought by
Neese Charles David
Purchase Details
Closed on
Nov 12, 1991
Bought by
Neece Charles David
Purchase Details
Closed on
Dec 31, 1986
Bought by
Walker Loyd E
Create a Home Valuation Report for This Property
The Home Valuation Report is an in-depth analysis detailing your home's value as well as a comparison with similar homes in the area
Home Values in the Area
Average Home Value in this Area
Purchase History
| Date | Buyer | Sale Price | Title Company |
|---|---|---|---|
| Simolari Michelle | $91,500 | -- | |
| Massey Phillip L | $82,000 | -- | |
| Neese Charles David | -- | -- | |
| Neece Charles David | $65,000 | -- | |
| Walker Loyd E | -- | -- |
Source: Public Records
Mortgage History
| Date | Status | Borrower | Loan Amount |
|---|---|---|---|
| Open | Simolari Michelle | $91,500 | |
| Previous Owner | Massey Phillip L | $65,600 |
Source: Public Records
Tax History Compared to Growth
Tax History
| Year | Tax Paid | Tax Assessment Tax Assessment Total Assessment is a certain percentage of the fair market value that is determined by local assessors to be the total taxable value of land and additions on the property. | Land | Improvement |
|---|---|---|---|---|
| 2025 | $1,265 | $59,865 | $17,587 | $42,278 |
| 2024 | $1,187 | $55,718 | $16,436 | $39,282 |
| 2023 | $1,187 | $58,120 | $15,219 | $42,901 |
| 2022 | $1,019 | $46,054 | $15,219 | $30,835 |
| 2021 | $981 | $41,942 | $14,494 | $27,448 |
| 2020 | $986 | $41,942 | $14,494 | $27,448 |
| 2019 | $1,053 | $40,781 | $14,606 | $26,174 |
| 2018 | $1,056 | $40,781 | $14,606 | $26,174 |
| 2017 | $1,055 | $40,781 | $14,606 | $26,175 |
| 2016 | $1,045 | $40,781 | $14,606 | $26,174 |
| 2015 | $1,030 | $40,781 | $14,606 | $26,174 |
| 2014 | $1,024 | $40,781 | $14,606 | $26,174 |
Source: Public Records
Map
Nearby Homes
- 1367 Sharpsburg McCollum Rd
- 131 Pecan Lake Dr
- 20 Beaver Creek Ln
- 65 Ellis Rd
- 0 Highway 154 Unit 10470800
- 0 Pinegate Way Unit 10436279
- 150 Park Timbers Dr
- 150 Riverside Dr
- 45 Riverside Walk
- 270 Sturgess Run
- 11 Masters Way
- 165 Bartlett Dr
- 75 Olympia Dr
- 20 Platinum Ridge
- 25 Chemin Place
- 41 Masters Dr
- 5 Riverside Dr
- 110 Crawford Cir
- 80 Vineyards Dr
- Spring Forest Way Lot: 2-1
- 148 Emory Phillips Rd
- 124 Emory Phillips Rd
- 98 Emory Phillips Rd
- 1565 Emory Phillips Rd
- 78 Emory Phillips Rd
- 1533 Highway 154
- 177 Emory Phillips Rd
- 1527 Highway 154
- 237 Emory Phillips Rd
- 56 Emory Phillips Rd Unit 2
- 56 Emory Phillips Rd
- 0 Emory Phillips Rd Unit 20023280
- 0 Emory Phillips Rd Unit 7011287
- 0 Emory Phillips Rd Unit 8197126
- 0 Emory Phillips Rd Unit 2
- 44 Emory Phillips Rd
- 255 Emory Phillips Rd
- 259 Emory Phillips Rd
- 1467 Highway 154
- 1467 Sharpsburg McCollum Rd