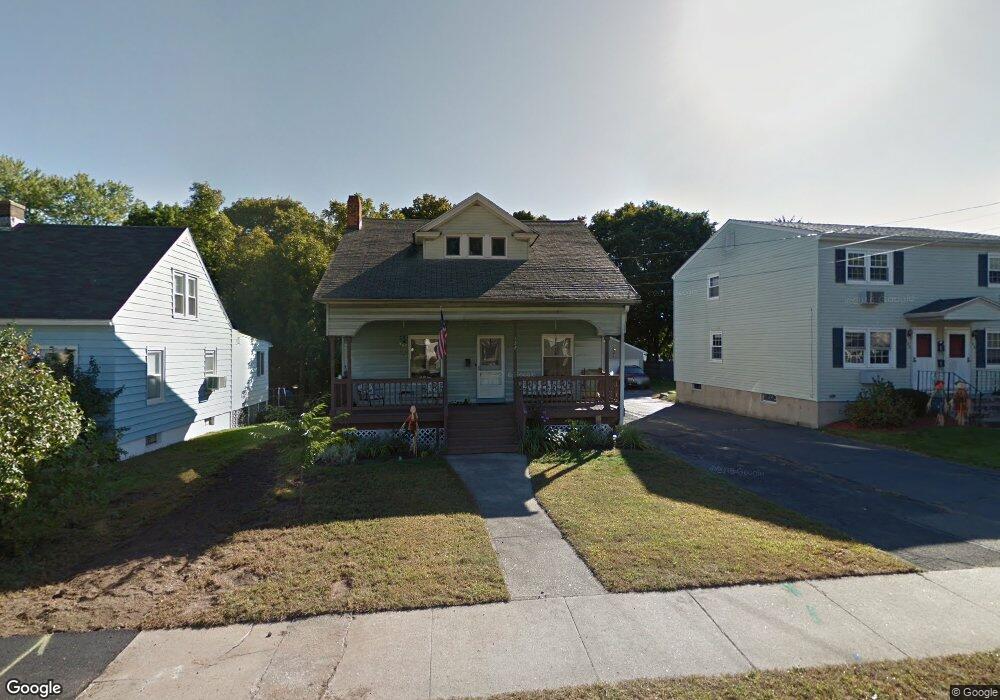
132 Gorman St Naugatuck, CT 06770
Estimated Value: $284,081 - $315,000
3
Beds
1
Bath
1,372
Sq Ft
$217/Sq Ft
Est. Value
About This Home
This home is located at 132 Gorman St, Naugatuck, CT 06770 and is currently estimated at $297,270, approximately $216 per square foot. 132 Gorman St is a home located in New Haven County with nearby schools including City Hill Middle School and Naugatuck High School.
Ownership History
Date
Name
Owned For
Owner Type
Purchase Details
Closed on
Aug 23, 2019
Sold by
Best Michael
Bought by
Best Dana
Current Estimated Value
Purchase Details
Closed on
Jul 1, 2015
Sold by
Damato Anthony F and Damato Jamie
Bought by
Best Michael and Best Dana
Home Financials for this Owner
Home Financials are based on the most recent Mortgage that was taken out on this home.
Original Mortgage
$107,200
Interest Rate
3.83%
Mortgage Type
New Conventional
Purchase Details
Closed on
Dec 7, 2010
Sold by
Damato Jamie
Bought by
Damato Jamie and Damato Anthony F
Home Financials for this Owner
Home Financials are based on the most recent Mortgage that was taken out on this home.
Original Mortgage
$100,000
Interest Rate
4.5%
Mortgage Type
Purchase Money Mortgage
Create a Home Valuation Report for This Property
The Home Valuation Report is an in-depth analysis detailing your home's value as well as a comparison with similar homes in the area
Home Values in the Area
Average Home Value in this Area
Purchase History
| Date | Buyer | Sale Price | Title Company |
|---|---|---|---|
| Best Dana | -- | -- | |
| Best Michael | $134,000 | -- | |
| Damato Jamie | -- | -- | |
| Damato Jamie | $133,334 | -- |
Source: Public Records
Mortgage History
| Date | Status | Borrower | Loan Amount |
|---|---|---|---|
| Previous Owner | Damato Jamie | $107,200 | |
| Previous Owner | Damato Jamie | $100,000 | |
| Previous Owner | Damato Jamie | $75,000 |
Source: Public Records
Tax History Compared to Growth
Tax History
| Year | Tax Paid | Tax Assessment Tax Assessment Total Assessment is a certain percentage of the fair market value that is determined by local assessors to be the total taxable value of land and additions on the property. | Land | Improvement |
|---|---|---|---|---|
| 2025 | $5,097 | $128,100 | $28,840 | $99,260 |
| 2024 | $5,353 | $128,100 | $28,840 | $99,260 |
| 2023 | $5,732 | $128,100 | $28,840 | $99,260 |
| 2022 | $4,223 | $88,430 | $31,100 | $57,330 |
| 2021 | $4,223 | $88,430 | $31,100 | $57,330 |
| 2020 | $3,958 | $82,900 | $31,100 | $51,800 |
| 2019 | $3,917 | $82,900 | $31,100 | $51,800 |
| 2018 | $4,356 | $90,100 | $37,420 | $52,680 |
| 2017 | $4,374 | $90,100 | $37,420 | $52,680 |
| 2016 | $4,295 | $90,100 | $37,420 | $52,680 |
| 2015 | $4,106 | $90,100 | $37,420 | $52,680 |
| 2014 | $4,060 | $90,100 | $37,420 | $52,680 |
| 2012 | $4,519 | $134,690 | $47,250 | $87,440 |
Source: Public Records
Map
Nearby Homes