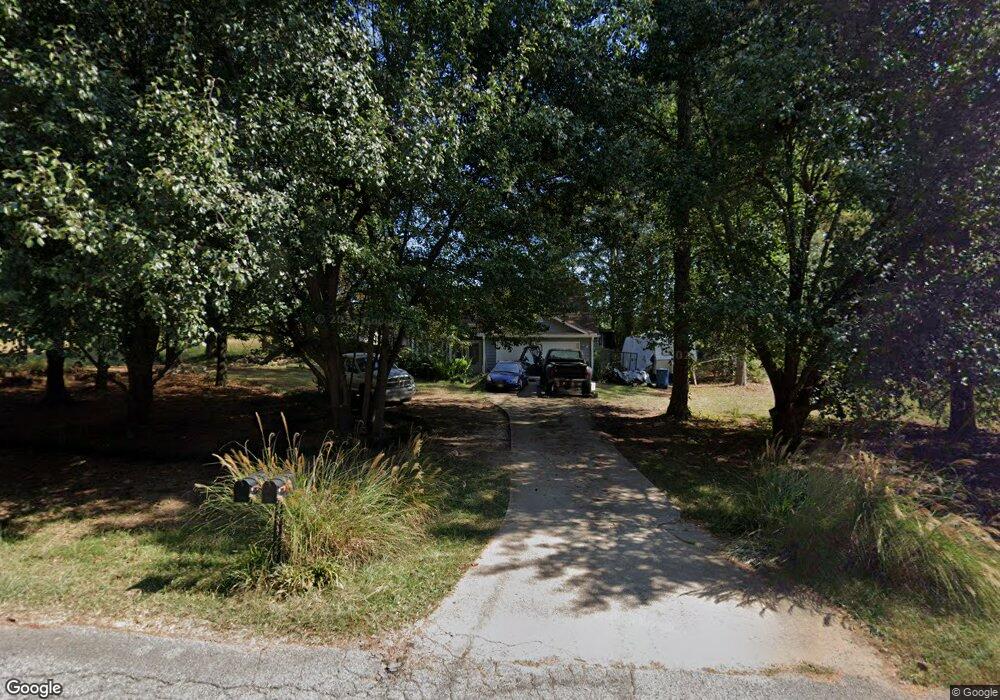
132 Johns Bluff Auburn, GA 30011
Estimated Value: $231,000 - $294,000
2
Beds
3
Baths
1,262
Sq Ft
$215/Sq Ft
Est. Value
About This Home
This home is located at 132 Johns Bluff, Auburn, GA 30011 and is currently estimated at $271,849, approximately $215 per square foot. 132 Johns Bluff is a home located in Barrow County with nearby schools including Auburn Elementary School, Westside Middle School, and Apalachee High School.
Ownership History
Date
Name
Owned For
Owner Type
Purchase Details
Closed on
Aug 27, 2021
Sold by
Barnes Stephen C
Bought by
Barnes Stephen C and Clark Mary Elizabeth
Current Estimated Value
Home Financials for this Owner
Home Financials are based on the most recent Mortgage that was taken out on this home.
Original Mortgage
$175,366
Outstanding Balance
$158,833
Interest Rate
2.8%
Mortgage Type
FHA
Estimated Equity
$113,016
Purchase Details
Closed on
Aug 26, 2021
Sold by
Barnes William L
Bought by
Barnes Stephen C
Home Financials for this Owner
Home Financials are based on the most recent Mortgage that was taken out on this home.
Original Mortgage
$175,366
Outstanding Balance
$158,833
Interest Rate
2.8%
Mortgage Type
FHA
Estimated Equity
$113,016
Purchase Details
Closed on
Dec 2, 1996
Sold by
Mcguire Thomas Rebecca
Bought by
Barnes William Dorothy
Purchase Details
Closed on
Oct 13, 1995
Sold by
Mcguire Thomas M and Mcguire R
Bought by
Mcguire Thomas M And
Purchase Details
Closed on
Jun 1, 1989
Bought by
Mcguire Thomas M and Mcguire R
Create a Home Valuation Report for This Property
The Home Valuation Report is an in-depth analysis detailing your home's value as well as a comparison with similar homes in the area
Home Values in the Area
Average Home Value in this Area
Purchase History
| Date | Buyer | Sale Price | Title Company |
|---|---|---|---|
| Barnes Stephen C | -- | -- | |
| Barnes Stephen C | -- | -- | |
| Barnes Stephen C | $205,000 | -- | |
| Barnes William Dorothy | $85,000 | -- | |
| Mcguire Thomas M And | -- | -- | |
| Mcguire Thomas M | $68,300 | -- |
Source: Public Records
Mortgage History
| Date | Status | Borrower | Loan Amount |
|---|---|---|---|
| Open | Barnes Stephen C | $175,366 | |
| Closed | Barnes William Dorothy | $0 |
Source: Public Records
Tax History Compared to Growth
Tax History
| Year | Tax Paid | Tax Assessment Tax Assessment Total Assessment is a certain percentage of the fair market value that is determined by local assessors to be the total taxable value of land and additions on the property. | Land | Improvement |
|---|---|---|---|---|
| 2024 | $2,377 | $77,436 | $24,000 | $53,436 |
| 2023 | $1,989 | $77,436 | $24,000 | $53,436 |
| 2022 | $2,118 | $71,622 | $18,800 | $52,822 |
| 2021 | $1,792 | $56,586 | $14,800 | $41,786 |
| 2020 | $1,645 | $51,606 | $11,200 | $40,406 |
| 2019 | $1,580 | $48,847 | $11,200 | $37,647 |
| 2018 | $1,398 | $43,329 | $11,200 | $32,129 |
| 2017 | $203 | $35,147 | $9,000 | $26,147 |
| 2016 | $972 | $30,066 | $9,000 | $21,066 |
| 2015 | $982 | $30,350 | $9,000 | $21,350 |
| 2014 | $910 | $29,022 | $6,272 | $22,750 |
| 2013 | -- | $28,288 | $6,272 | $22,016 |
Source: Public Records
Map
Nearby Homes
- 386 10th St Lot 57
- 00 Atlanta Hwy
- 1127 Bradford Park Dr
- 41 Hydrangea Lane Lot 73
- 83 Arnold Poplar Ln
- 10 Spirea Way Lot 69
- 41 Hydrangea Ln Unit 73
- 51 Little Magnolia Ln
- 93 Little Magnolia Ln
- 46 Spirea Way Lot 64
- 4079 Brookmont Way
- 5779 Wheeler Ridge Rd
- 298 Dandelion Ln
- 1277 4th Ave
- 302 Jonaquil Ave
- 1071 Atlanta Hwy NW
- 410 Kilcrease Rd
- 120 Mt Moriah Rd
- 23 Woodland Rd
- 1201 Saint Andrews Dr
- 134 Johns Bluff Unit 2
- 131 Johns Bluff Unit 2
- 133 Johns Bluff
- 133 Johns Bluff Unit 2
- 136 Johns Bluff
- 121 Governors Ridge
- 121 Governors Ridge NW
- 125 Carl Midway Church Rd
- 135 Johns Bluff
- 136 Carl Midway Church Rd
- 138 Johns Bluff
- 123 Governors Ridge
- 123 Governors Ridge NW
- 137 Crest Pointe Ct
- 137 Crest Pointe Ct Unit 2
- 125 Governors Ridge
- 120 Governors Ridge
- 120 Governors Ridge Unit 1
- 120 Governors Ridge NW
- 140 Johns Bluff Unit 2