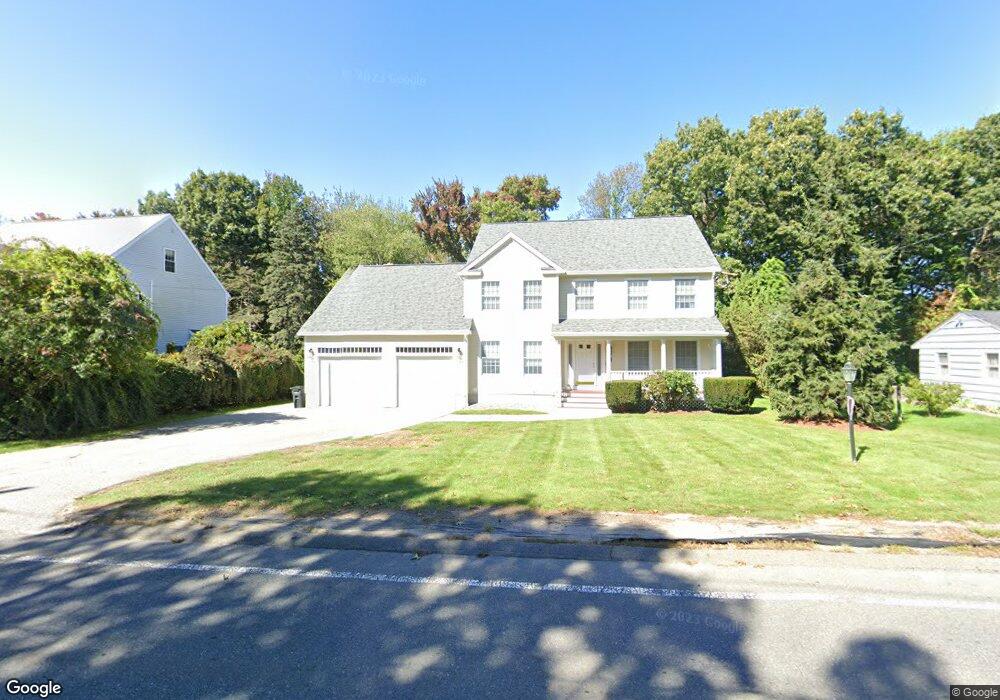
132 Maple St Lexington, MA 02420
Countryside NeighborhoodEstimated Value: $1,839,242 - $2,148,000
4
Beds
3
Baths
2,800
Sq Ft
$716/Sq Ft
Est. Value
About This Home
This home is located at 132 Maple St, Lexington, MA 02420 and is currently estimated at $2,004,561, approximately $715 per square foot. 132 Maple St is a home located in Middlesex County with nearby schools including Harrington Elementary School, Jonas Clarke Middle School, and Lexington High School.
Ownership History
Date
Name
Owned For
Owner Type
Purchase Details
Closed on
Mar 18, 2019
Sold by
Harisinghani Mukesh and Harisinghani Alpana M
Bought by
132 Maple Street Rt
Current Estimated Value
Purchase Details
Closed on
Jan 15, 2004
Sold by
Maranhao Josue A and Maranhao Iraci T
Bought by
Harisinghani Alpana and Harisinghani Mukesh
Home Financials for this Owner
Home Financials are based on the most recent Mortgage that was taken out on this home.
Original Mortgage
$630,000
Interest Rate
5.98%
Mortgage Type
Purchase Money Mortgage
Purchase Details
Closed on
Oct 28, 1999
Sold by
Maple Street Rt
Bought by
Seaver Scott
Create a Home Valuation Report for This Property
The Home Valuation Report is an in-depth analysis detailing your home's value as well as a comparison with similar homes in the area
Home Values in the Area
Average Home Value in this Area
Purchase History
| Date | Buyer | Sale Price | Title Company |
|---|---|---|---|
| 132 Maple Street Rt | -- | -- | |
| Harisinghani Alpana | $840,000 | -- | |
| Seaver Scott | $267,500 | -- |
Source: Public Records
Mortgage History
| Date | Status | Borrower | Loan Amount |
|---|---|---|---|
| Previous Owner | Seaver Scott | $405,000 | |
| Previous Owner | Seaver Scott | $460,000 | |
| Previous Owner | Harisinghani Alpana | $630,000 | |
| Previous Owner | Seaver Scott | $414,670 | |
| Previous Owner | Seaver Scott | $55,000 |
Source: Public Records
Tax History
| Year | Tax Paid | Tax Assessment Tax Assessment Total Assessment is a certain percentage of the fair market value that is determined by local assessors to be the total taxable value of land and additions on the property. | Land | Improvement |
|---|---|---|---|---|
| 2025 | $20,669 | $1,690,000 | $718,000 | $972,000 |
| 2024 | $19,870 | $1,622,000 | $684,000 | $938,000 |
| 2023 | $18,590 | $1,430,000 | $622,000 | $808,000 |
| 2022 | $17,954 | $1,301,000 | $565,000 | $736,000 |
| 2021 | $18,189 | $1,264,000 | $515,000 | $749,000 |
| 2020 | $16,860 | $1,200,000 | $515,000 | $685,000 |
| 2019 | $16,365 | $1,159,000 | $491,000 | $668,000 |
| 2018 | $16,488 | $1,153,000 | $522,000 | $631,000 |
| 2017 | $16,069 | $1,109,000 | $497,000 | $612,000 |
| 2016 | $16,045 | $1,099,000 | $468,000 | $631,000 |
| 2015 | $15,246 | $1,026,000 | $425,000 | $601,000 |
| 2014 | $14,285 | $921,000 | $386,000 | $535,000 |
Source: Public Records
Map
Nearby Homes
Your Personal Tour Guide
Ask me questions while you tour the home.