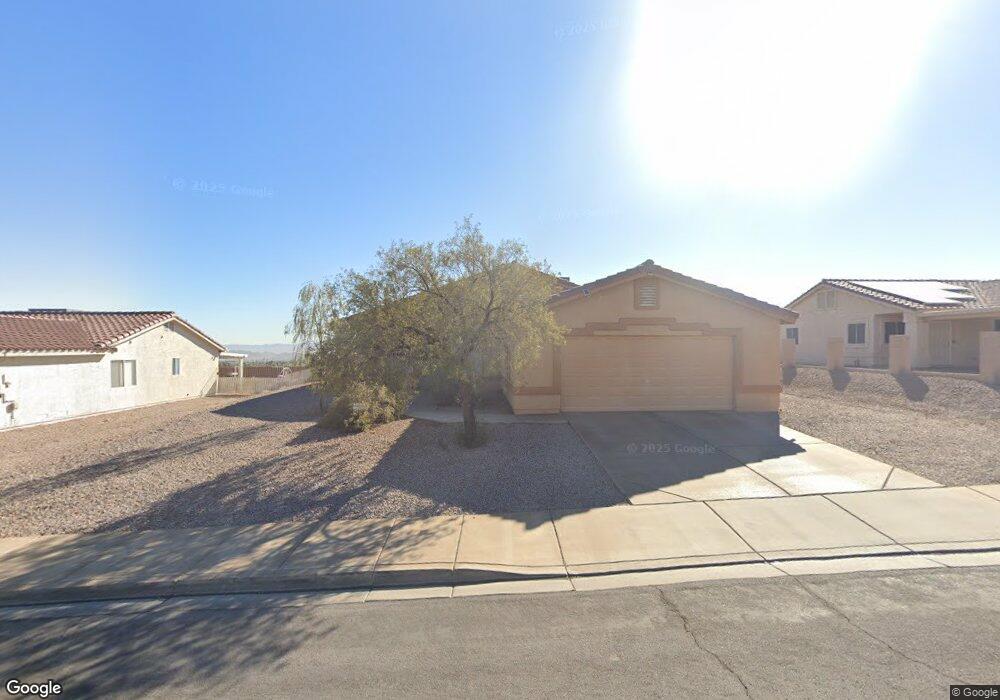
132 Mauve St Unit 2C Henderson, NV 89012
McCullough Hills NeighborhoodEstimated Value: $475,605 - $518,000
3
Beds
2
Baths
1,780
Sq Ft
$279/Sq Ft
Est. Value
About This Home
This home is located at 132 Mauve St Unit 2C, Henderson, NV 89012 and is currently estimated at $495,901, approximately $278 per square foot. 132 Mauve St Unit 2C is a home located in Clark County with nearby schools including Ulis Newton Elementary School, Jack & Terry Mannion Middle School, and Foothill High School.
Ownership History
Date
Name
Owned For
Owner Type
Purchase Details
Closed on
Aug 10, 2012
Sold by
Curtis Nanine Beth-Bergmann and Bergmann Nanine Beth-Bergmann
Bought by
Curtis Nanine Beth-Bergmann and Curtis Byron
Current Estimated Value
Home Financials for this Owner
Home Financials are based on the most recent Mortgage that was taken out on this home.
Original Mortgage
$234,400
Outstanding Balance
$100,250
Interest Rate
3.53%
Mortgage Type
New Conventional
Estimated Equity
$395,651
Purchase Details
Closed on
Jan 27, 2005
Sold by
Orr James Edward
Bought by
Berymann Nanine and Curtis Byron
Home Financials for this Owner
Home Financials are based on the most recent Mortgage that was taken out on this home.
Original Mortgage
$272,000
Interest Rate
5.74%
Mortgage Type
Unknown
Purchase Details
Closed on
Oct 30, 2002
Sold by
Orr Ludean Draken
Bought by
Orr James Edward
Purchase Details
Closed on
Feb 7, 2001
Sold by
National Horizon Corp
Bought by
Orr James Edward and Orr Ludean
Create a Home Valuation Report for This Property
The Home Valuation Report is an in-depth analysis detailing your home's value as well as a comparison with similar homes in the area
Home Values in the Area
Average Home Value in this Area
Purchase History
| Date | Buyer | Sale Price | Title Company |
|---|---|---|---|
| Curtis Nanine Beth-Bergmann | -- | None Available | |
| Berymann Nanine | $340,000 | Old Republic Title Co Of Nv | |
| Orr James Edward | $160,000 | -- | |
| Orr James Edward | $160,800 | Old Republic Title Company |
Source: Public Records
Mortgage History
| Date | Status | Borrower | Loan Amount |
|---|---|---|---|
| Open | Curtis Nanine Beth-Bergmann | $234,400 | |
| Previous Owner | Berymann Nanine | $272,000 | |
| Closed | Berymann Nanine | $68,000 |
Source: Public Records
Tax History Compared to Growth
Tax History
| Year | Tax Paid | Tax Assessment Tax Assessment Total Assessment is a certain percentage of the fair market value that is determined by local assessors to be the total taxable value of land and additions on the property. | Land | Improvement |
|---|---|---|---|---|
| 2025 | $1,888 | $112,088 | $38,850 | $73,238 |
| 2024 | $1,833 | $112,088 | $38,850 | $73,238 |
| 2023 | $1,833 | $103,856 | $34,650 | $69,206 |
| 2022 | $1,780 | $94,006 | $30,800 | $63,206 |
| 2021 | $1,728 | $88,208 | $28,000 | $60,208 |
| 2020 | $1,675 | $87,682 | $28,000 | $59,682 |
| 2019 | $1,654 | $83,633 | $24,850 | $58,783 |
| 2018 | $1,579 | $75,752 | $19,250 | $56,502 |
| 2017 | $2,135 | $73,665 | $16,450 | $57,215 |
| 2016 | $1,478 | $69,439 | $12,250 | $57,189 |
| 2015 | $1,474 | $57,206 | $9,800 | $47,406 |
| 2014 | $1,431 | $47,952 | $7,700 | $40,252 |
Source: Public Records
Map
Nearby Homes
- 439 Palegold St
- 374 Island Reef Ave
- 218 Shaded Canyon Dr
- 416 Richgold St
- 270 Shaded Canyon Dr
- 410 Richgold St
- 406 Palegold St
- 429 Wright Way
- 302 Watteau Ct
- 441 Daylin Ct
- 370 Rosefinch St
- 342 Kandinsky Ct
- 431 Opal Dr Unit 2
- 478 Potomac St
- 468 Potomac St
- 197 Kings Canyon Ct
- 404 Viewmont Dr
- 475 Annapolis Cir
- 711 Florence Isle Ave
- 727 Florence Isle Ave
- 130 Mauve St
- 134 Mauve St
- 128 Mauve St
- 136 Mauve St
- 131 Mauve St
- 129 Lemongold St
- 131 Lemongold St Unit 1C
- 127 Lemongold St
- 127 Lemongold St Unit HOME
- 129 Mauve St
- 133 Lemongold St
- 125 Lemongold St
- 126 Mauve St
- 126 Mauve St Unit n/a
- 388 Eveningside Ave
- 135 Lemongold St
- 123 Lemongold St Unit 1C
- 138 Mauve St Unit 2C
- 124 Mauve St
- 386 Eveningside Ave