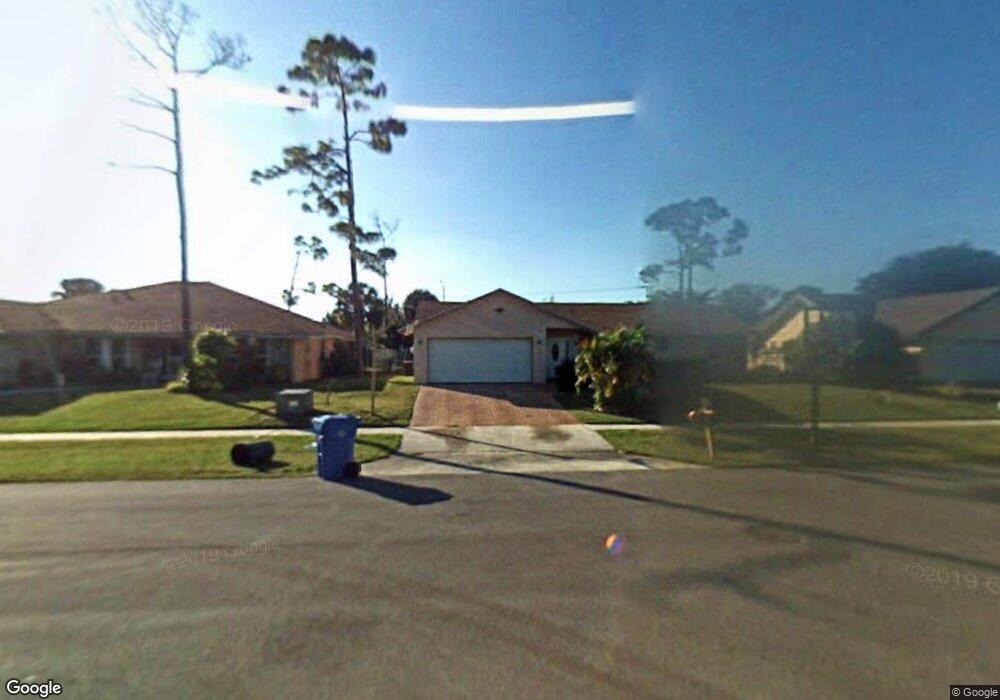
132 Miramar Ave Royal Palm Beach, FL 33411
La Mancha NeighborhoodEstimated Value: $489,836 - $551,000
3
Beds
2
Baths
1,608
Sq Ft
$331/Sq Ft
Est. Value
About This Home
This home is located at 132 Miramar Ave, Royal Palm Beach, FL 33411 and is currently estimated at $532,709, approximately $331 per square foot. 132 Miramar Ave is a home located in Palm Beach County with nearby schools including H.L. Johnson Elementary School, Crestwood Community Middle School, and Royal Palm Beach High School.
Ownership History
Date
Name
Owned For
Owner Type
Purchase Details
Closed on
Aug 22, 2016
Sold by
Santos Luz Perez
Bought by
Estima Urile and Riguel Estima Nelly Marie
Current Estimated Value
Purchase Details
Closed on
Oct 14, 2011
Sold by
Wells Fargo Bank Na
Bought by
Velazquez Luis Rigual and Santos Luz Perez
Purchase Details
Closed on
Apr 24, 2006
Sold by
Scott Samuel and Brutus Loretta
Bought by
Moers Gidget Marie
Home Financials for this Owner
Home Financials are based on the most recent Mortgage that was taken out on this home.
Original Mortgage
$63,300
Interest Rate
6.31%
Mortgage Type
Stand Alone Second
Purchase Details
Closed on
May 20, 1998
Sold by
Graham Rufus C and Graham Tracy J
Bought by
Scott Samuel and Brutus Loretta
Home Financials for this Owner
Home Financials are based on the most recent Mortgage that was taken out on this home.
Original Mortgage
$111,850
Interest Rate
7.04%
Mortgage Type
FHA
Create a Home Valuation Report for This Property
The Home Valuation Report is an in-depth analysis detailing your home's value as well as a comparison with similar homes in the area
Home Values in the Area
Average Home Value in this Area
Purchase History
| Date | Buyer | Sale Price | Title Company |
|---|---|---|---|
| Estima Urile | -- | None Available | |
| Velazquez Luis Rigual | $126,000 | None Available | |
| Moers Gidget Marie | $316,500 | None Available | |
| Scott Samuel | $113,000 | -- |
Source: Public Records
Mortgage History
| Date | Status | Borrower | Loan Amount |
|---|---|---|---|
| Previous Owner | Moers Gidget Marie | $63,300 | |
| Previous Owner | Moers Gidget Marie | $253,200 | |
| Previous Owner | Scott Samuel | $111,850 |
Source: Public Records
Tax History Compared to Growth
Tax History
| Year | Tax Paid | Tax Assessment Tax Assessment Total Assessment is a certain percentage of the fair market value that is determined by local assessors to be the total taxable value of land and additions on the property. | Land | Improvement |
|---|---|---|---|---|
| 2024 | $3,774 | $238,078 | -- | -- |
| 2023 | $3,672 | $231,144 | $0 | $0 |
| 2022 | $3,619 | $224,412 | $0 | $0 |
| 2021 | $3,588 | $217,876 | $0 | $0 |
| 2020 | $3,556 | $214,868 | $0 | $0 |
| 2019 | $3,503 | $210,037 | $0 | $0 |
| 2018 | $3,326 | $206,121 | $0 | $0 |
| 2017 | $3,291 | $201,881 | $64,509 | $137,372 |
| 2016 | $3,671 | $165,637 | $0 | $0 |
| 2015 | $3,457 | $150,579 | $0 | $0 |
| 2014 | $3,125 | $136,890 | $0 | $0 |
Source: Public Records
Map
Nearby Homes
- 110 Parkwood Dr
- 287 Ponce de Leon St
- 187 Parkwood Dr
- 160 Parkwood Dr
- 3210 Dunning Dr
- 77 Westecunk Dr
- 1114 Brinely Place
- 3212 Klays Ct
- 236 Par Dr
- 3210 Klays Ct
- 420 La Mancha Ave
- 2470 Westmont Ln
- 145 Santa Monica Ave
- 124 Rivera Ave
- 128 Royal Pine Cir N
- 3202 Klays Ct
- 113 Madrid St
- 3252 Dunning Dr
- 116 Santa Monica Ave
- 109 Rivera Ave
- 130 Miramar Ave
- 134 Miramar Ave
- 128 Miramar Ave
- 136 Miramar Ave
- 127 Miramar Ave
- 135 Vedado Ct
- 108 Sherwood Dr
- 104 Sherwood Dr
- 138 Miramar Ave
- 125 Miramar Ave
- 112 Sherwood Dr
- 102 Sherwood Dr
- 124 Miramar Ave
- 129 Vedado Ct
- 139 Miramar Ave
- 140 Miramar Ave
- 131 Vedado Ct
- 123 Miramar Ave
- 100 Sherwood Dr
- 114 Sherwood Dr