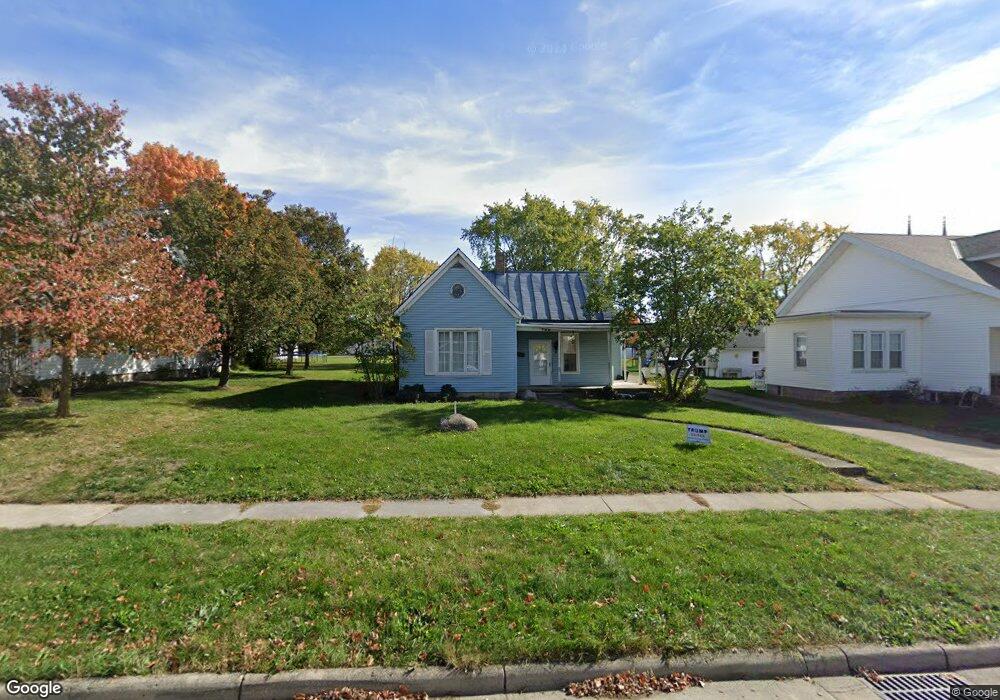
132 N Frankfort St Minster, OH 45865
Estimated Value: $176,000 - $241,000
3
Beds
1
Bath
1,300
Sq Ft
$155/Sq Ft
Est. Value
About This Home
This home is located at 132 N Frankfort St, Minster, OH 45865 and is currently estimated at $201,679, approximately $155 per square foot. 132 N Frankfort St is a home located in Auglaize County with nearby schools including Minster Elementary School and Minster Junior/Senior High School.
Ownership History
Date
Name
Owned For
Owner Type
Purchase Details
Closed on
May 9, 2024
Sold by
J Henry Wacker Farm Llc
Bought by
Grissett Timothy J
Current Estimated Value
Home Financials for this Owner
Home Financials are based on the most recent Mortgage that was taken out on this home.
Original Mortgage
$87,000
Outstanding Balance
$85,766
Interest Rate
6.82%
Mortgage Type
Credit Line Revolving
Estimated Equity
$115,913
Purchase Details
Closed on
Jun 29, 2017
Sold by
Sharp Thomas D and Sharp Tina M
Bought by
J Henry Wacker Farm Llc
Purchase Details
Closed on
May 16, 1996
Sold by
Wilt Mark
Bought by
Sharp Thomas D
Purchase Details
Closed on
Oct 11, 1991
Sold by
Schmiesing Dennis W
Bought by
Wilt Mark
Purchase Details
Closed on
Jul 3, 1991
Sold by
Schmiesing Timothy T
Bought by
Schmiesing Dennis W
Purchase Details
Closed on
Jan 1, 1985
Create a Home Valuation Report for This Property
The Home Valuation Report is an in-depth analysis detailing your home's value as well as a comparison with similar homes in the area
Home Values in the Area
Average Home Value in this Area
Purchase History
| Date | Buyer | Sale Price | Title Company |
|---|---|---|---|
| Grissett Timothy J | $103,200 | None Listed On Document | |
| J Henry Wacker Farm Llc | $41,333 | Attorney | |
| Sharp Thomas D | $77,000 | -- | |
| Wilt Mark | $66,500 | -- | |
| Schmiesing Dennis W | -- | -- | |
| -- | $36,500 | -- |
Source: Public Records
Mortgage History
| Date | Status | Borrower | Loan Amount |
|---|---|---|---|
| Open | Grissett Timothy J | $87,000 |
Source: Public Records
Tax History Compared to Growth
Tax History
| Year | Tax Paid | Tax Assessment Tax Assessment Total Assessment is a certain percentage of the fair market value that is determined by local assessors to be the total taxable value of land and additions on the property. | Land | Improvement |
|---|---|---|---|---|
| 2024 | $3,815 | $54,920 | $15,740 | $39,180 |
| 2023 | $1,913 | $54,920 | $15,740 | $39,180 |
| 2022 | $1,774 | $47,140 | $14,440 | $32,700 |
| 2021 | $1,806 | $47,140 | $14,440 | $32,700 |
| 2020 | $932 | $47,142 | $14,445 | $32,697 |
| 2019 | $1,627 | $38,742 | $11,872 | $26,870 |
| 2018 | $1,587 | $38,742 | $11,872 | $26,870 |
| 2017 | $1,473 | $38,742 | $11,872 | $26,870 |
| 2016 | $1,322 | $33,944 | $10,770 | $23,174 |
| 2015 | $1,299 | $33,944 | $10,770 | $23,174 |
| 2014 | $1,301 | $33,944 | $10,770 | $23,174 |
| 2013 | $1,364 | $33,944 | $10,770 | $23,174 |
Source: Public Records
Map
Nearby Homes
- 47 N Frankfort St
- 17 Stonegate Dr
- 0 Stonegate Dr Unit 21 10544857
- 0 Stonegate Dr Unit 14 10544847
- 36 Shania Place Unit 23
- 27 Shania Place Unit 26
- 19 Shania Place Unit 33
- 28 Shania Place Unit 33
- 11 Shania Place Unit 28
- 193 N Paris St
- 561 S Walnut St Unit Lot3
- 323 Margaret St
- 319 Margaret St
- 316 Margaret St
- 312 Margaret St
- 129 Janice Dr
- 130 Janice Dr
- 416 E Plum St
- 420 E Plum St
- 424 E Plum St
- 140 N Frankfort St
- 124 N Frankfort St
- 80 W 5th St
- 68 W 5th St
- 116 N Frankfort St
- 54 W 5th St
- 156 N Frankfort St
- 131 N Hanover St
- 139 N Hanover St
- 121 S Frankfort St
- 40 W 5th St
- 164 N Frankfort St
- 131 N Frankfort St
- 127 N Frankfort St
- 139 N Frankfort St
- 32 W 5th St
- 121 N Frankfort St
- 115 N Hanover St
- 115 N Hanover St
- 105 N Frankfort St