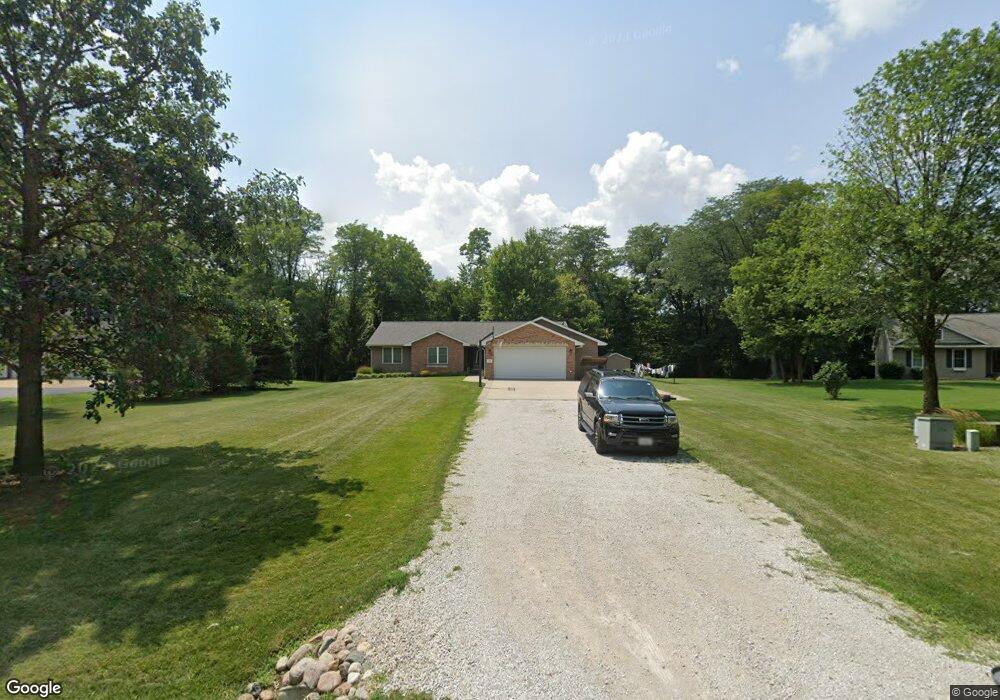
132 N Grimm Rd Goodfield, IL 61742
Estimated Value: $327,000 - $436,000
--
Bed
--
Bath
3,746
Sq Ft
$102/Sq Ft
Est. Value
About This Home
This home is located at 132 N Grimm Rd, Goodfield, IL 61742 and is currently estimated at $382,481, approximately $102 per square foot. 132 N Grimm Rd is a home located in Woodford County with nearby schools including Eureka High School.
Create a Home Valuation Report for This Property
The Home Valuation Report is an in-depth analysis detailing your home's value as well as a comparison with similar homes in the area
Home Values in the Area
Average Home Value in this Area
Tax History Compared to Growth
Tax History
| Year | Tax Paid | Tax Assessment Tax Assessment Total Assessment is a certain percentage of the fair market value that is determined by local assessors to be the total taxable value of land and additions on the property. | Land | Improvement |
|---|---|---|---|---|
| 2024 | $6,902 | $100,393 | $13,840 | $86,553 |
| 2023 | $6,006 | $91,299 | $12,586 | $78,713 |
| 2022 | $5,696 | $84,147 | $11,600 | $72,547 |
| 2021 | $5,596 | $79,459 | $10,954 | $68,505 |
| 2020 | $5,413 | $77,484 | $10,682 | $66,802 |
| 2019 | $5,247 | $77,484 | $10,682 | $66,802 |
| 2018 | $5,306 | $77,484 | $10,682 | $66,802 |
| 2017 | $5,246 | $75,965 | $10,473 | $65,492 |
| 2016 | $5,132 | $73,347 | $10,112 | $63,235 |
| 2015 | $3,953 | $72,874 | $10,047 | $62,827 |
| 2014 | $3,953 | $72,874 | $10,047 | $62,827 |
| 2013 | $3,953 | $71,564 | $9,866 | $61,698 |
Source: Public Records
Map
Nearby Homes
- 1501 US Highway 150
- 493 Reaba Ave
- 109 Main St
- 297 MacAllen Lake Rd
- Lot 39 Mapleleaf
- Lot 38 Mapleleaf
- Lot 47 Parkview
- Lot 51 Parkview
- Lot 26 Parkview
- Lot 6 Parkview
- Lot 18 Parkview
- Lot 43 Parkview
- Lot 50 Parkview
- Lot 17 Parkview
- Lot 44 Parkview
- Lot 48 Parkview
- Lot 15 Parkview
- Lot 42 Greenview
- Lot 54 Greenview
- Lot 40 Greenview
- 130 N Grimm Rd
- 134 N Grimm Rd
- 128 N Grimm Rd
- 358 Grimm Rd
- 126 N Grimm Rd
- 364 Grimm Rd
- 124 N Grimm Rd
- 122 N Grimm Rd
- 354 Grimm Rd
- 120 N Grimm Rd
- 350 Grimm Rd
- 118 N Grimm Rd
- 1501 Timberline Rd
- 114 N Grimm Rd
- 116 N Grimm Rd
- 1507 Timberline Rd
- 112 N Grimm Rd
- 342 Grimm Rd
- 1504 Timberline Rd
- 110 N Grimm Rd