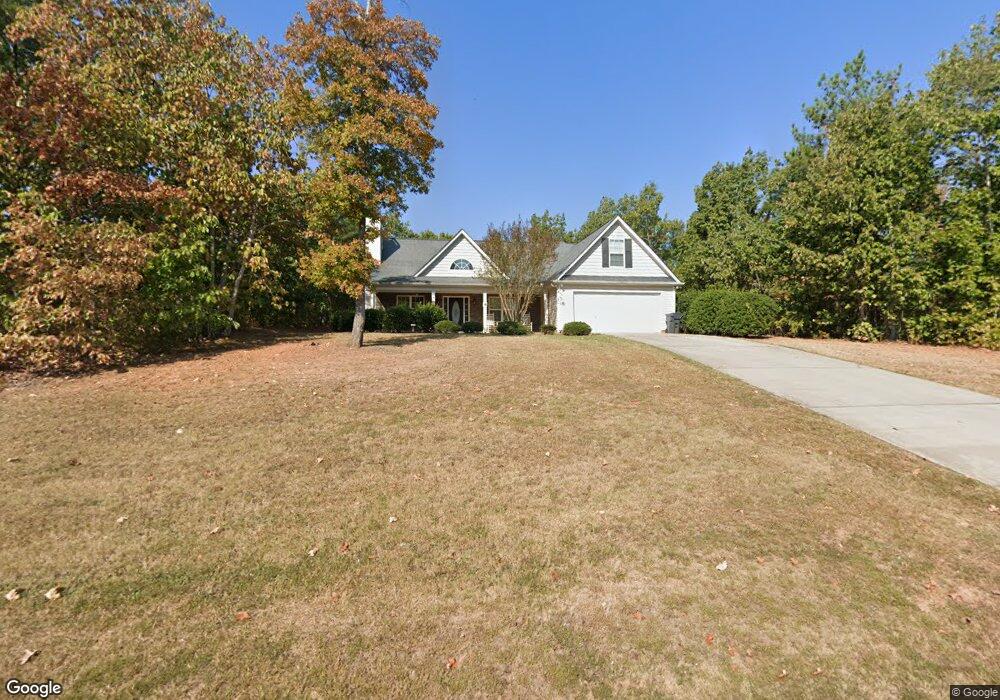
132 Oak Ridge Dr Unit 10 Barnesville, GA 30204
Estimated Value: $274,000 - $332,000
3
Beds
2
Baths
1,812
Sq Ft
$162/Sq Ft
Est. Value
About This Home
This home is located at 132 Oak Ridge Dr Unit 10, Barnesville, GA 30204 and is currently estimated at $294,041, approximately $162 per square foot. 132 Oak Ridge Dr Unit 10 is a home located in Lamar County with nearby schools including Lamar County Primary School, Lamar County Elementary School, and Lamar County Middle School.
Ownership History
Date
Name
Owned For
Owner Type
Purchase Details
Closed on
Mar 20, 2015
Sold by
Stevens Tina S
Bought by
Enyart Elizabeth Jean and Doyle Mark James
Current Estimated Value
Purchase Details
Closed on
Sep 25, 2008
Sold by
Mcintosh State Bank
Bought by
Stevens Tina S
Home Financials for this Owner
Home Financials are based on the most recent Mortgage that was taken out on this home.
Original Mortgage
$131,168
Interest Rate
6.36%
Mortgage Type
FHA
Purchase Details
Closed on
Aug 5, 2008
Sold by
Not Provided
Bought by
Stevens Tina S
Home Financials for this Owner
Home Financials are based on the most recent Mortgage that was taken out on this home.
Original Mortgage
$131,168
Interest Rate
6.36%
Mortgage Type
FHA
Purchase Details
Closed on
Jun 1, 2007
Sold by
Not Provided
Bought by
Stevens Tina S
Create a Home Valuation Report for This Property
The Home Valuation Report is an in-depth analysis detailing your home's value as well as a comparison with similar homes in the area
Purchase History
| Date | Buyer | Sale Price | Title Company |
|---|---|---|---|
| Enyart Elizabeth Jean | $129,500 | -- | |
| Stevens Tina S | $132,900 | -- | |
| Stevens Tina S | -- | -- | |
| Stevens Tina S | $187,500 | -- |
Source: Public Records
Mortgage History
| Date | Status | Borrower | Loan Amount |
|---|---|---|---|
| Previous Owner | Stevens Tina S | $131,168 |
Source: Public Records
Tax History
| Year | Tax Paid | Tax Assessment Tax Assessment Total Assessment is a certain percentage of the fair market value that is determined by local assessors to be the total taxable value of land and additions on the property. | Land | Improvement |
|---|---|---|---|---|
| 2025 | $2,119 | $113,571 | $6,000 | $107,571 |
| 2024 | $1,987 | $95,830 | $6,000 | $89,830 |
| 2023 | $2,115 | $94,810 | $6,000 | $88,810 |
| 2022 | $1,835 | $84,683 | $6,000 | $78,683 |
| 2021 | $1,743 | $67,352 | $6,000 | $61,352 |
| 2020 | $1,055 | $42,701 | $6,000 | $36,701 |
| 2019 | $963 | $39,701 | $3,000 | $36,701 |
| 2018 | $0 | $39,701 | $3,000 | $36,701 |
| 2017 | $928 | $39,701 | $3,000 | $36,701 |
| 2016 | $938 | $39,701 | $3,000 | $36,701 |
| 2015 | $1,142 | $39,701 | $3,000 | $36,701 |
| 2014 | $1,056 | $37,977 | $1,800 | $36,177 |
| 2013 | -- | $39,167 | $5,000 | $34,167 |
Source: Public Records
Map
Nearby Homes
- 125 Red Oak Dr
- 562 Johnstonville Rd
- 0 Veterans Unit 10705095
- 0 Veterans Unit 10714454
- 0 Veterans Unit 23619323
- 0 Veterans Unit 10429448
- 0 Veterans Unit 10675698
- 0 Roberts Rd Unit 10593586
- 0 Hannah St Unit LOT 1 10587177
- 0 Hannah Ct Unit LOT 13 10587187
- 0 Hannah Ct Unit LOT 10 10587183
- 0 Hannah Ct Unit LOT 14 10587190
- 24 Sims St
- 0 Martin Luther King Junior Pkwy
- 503 Forsyth St
- 880 Johnstonville Rd
- 209 Founders Dr
- 523 Fredonia Church Rd
- 0 Washington St Unit 10710879
- 107 1st St
- 132 Oak Ridge Dr
- 0 Oak Ridge Dr Unit 20064692
- 0 Oak Ridge Dr Unit 20008097
- 129 Oakridge Dr
- 0 Oak Ridge Dr Dr Unit 163494
- 113 Maple Ridge Ct
- 126 Maple Ridge Ct
- 135 Oak Ridge Dr
- 125 Oak Ridge Dr Unit 74
- 125 Oak Ridge Dr
- 114 Red Oak Dr
- 106 Red Oak Dr
- 123 Oakridge Dr
- 143 Oakridge Dr
- 151 Oakridge Dr
- 139 Oakridge Dr
- 118 Red Oak Dr
- 115 Maple Ridge Ct
- 115 Maple Ridge Ct Unit 1
- 115 Maple Ridge Ct Unit 8
Your Personal Tour Guide
Ask me questions while you tour the home.