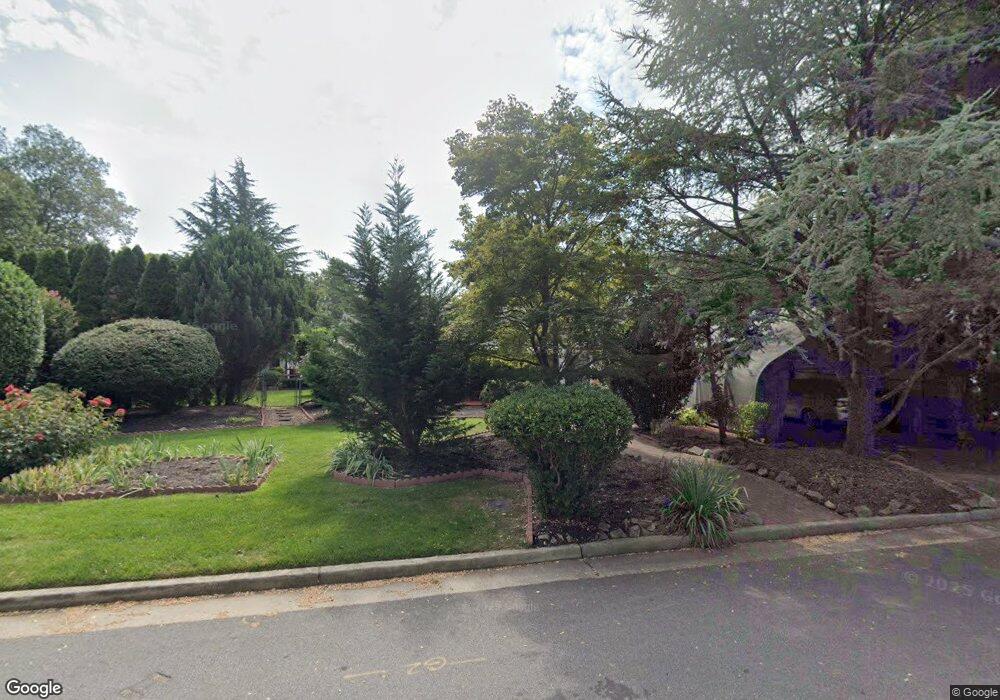
132 Olive St Piscataway, NJ 08854
Estimated Value: $575,000 - $641,000
3
Beds
2
Baths
1,616
Sq Ft
$373/Sq Ft
Est. Value
About This Home
This home is located at 132 Olive St, Piscataway, NJ 08854 and is currently estimated at $602,465, approximately $372 per square foot. 132 Olive St is a home located in Middlesex County with nearby schools including Arbor Intermediate School, Dwight D. Eisenhower School, and Quibbletown Middle School.
Ownership History
Date
Name
Owned For
Owner Type
Purchase Details
Closed on
Dec 5, 2005
Sold by
Stanwick Scott
Bought by
Falby Marjorie and Falby Gracelyn
Current Estimated Value
Home Financials for this Owner
Home Financials are based on the most recent Mortgage that was taken out on this home.
Original Mortgage
$284,000
Interest Rate
6.33%
Purchase Details
Closed on
Sep 22, 1993
Sold by
Kang Sung Soo
Bought by
Stanwick Scott and Stanwick Karen
Home Financials for this Owner
Home Financials are based on the most recent Mortgage that was taken out on this home.
Original Mortgage
$128,000
Interest Rate
6.9%
Mortgage Type
FHA
Create a Home Valuation Report for This Property
The Home Valuation Report is an in-depth analysis detailing your home's value as well as a comparison with similar homes in the area
Home Values in the Area
Average Home Value in this Area
Purchase History
| Date | Buyer | Sale Price | Title Company |
|---|---|---|---|
| Falby Marjorie | $355,000 | -- | |
| Stanwick Scott | $128,500 | -- |
Source: Public Records
Mortgage History
| Date | Status | Borrower | Loan Amount |
|---|---|---|---|
| Previous Owner | Falby Marjorie | $284,000 | |
| Previous Owner | Stanwick Scott | $128,000 |
Source: Public Records
Tax History Compared to Growth
Tax History
| Year | Tax Paid | Tax Assessment Tax Assessment Total Assessment is a certain percentage of the fair market value that is determined by local assessors to be the total taxable value of land and additions on the property. | Land | Improvement |
|---|---|---|---|---|
| 2025 | $7,474 | $447,100 | $268,200 | $178,900 |
| 2024 | $7,637 | $382,700 | $173,000 | $209,700 |
| 2023 | $7,637 | $365,400 | $173,000 | $192,400 |
| 2022 | $7,572 | $336,400 | $173,000 | $163,400 |
| 2021 | $7,476 | $319,200 | $173,000 | $146,200 |
| 2020 | $7,669 | $328,300 | $158,000 | $170,300 |
| 2019 | $7,051 | $296,500 | $158,000 | $138,500 |
| 2018 | $6,852 | $288,400 | $158,000 | $130,400 |
| 2017 | $6,628 | $241,000 | $118,000 | $123,000 |
| 2016 | $6,500 | $241,000 | $118,000 | $123,000 |
| 2015 | $6,411 | $241,000 | $118,000 | $123,000 |
| 2014 | $6,266 | $241,000 | $118,000 | $123,000 |
Source: Public Records
Map
Nearby Homes
- 65 Curtis Ave
- 1866 W 7th St
- 503 S Washington Ave
- 417 Valmere Ave
- 456 Valmere Ave
- 203 Walnut St
- 423 New Market Rd
- 118 Jadach Dr
- 261 New Market Rd
- 415 Walnut St
- 614 S Washington Ave
- 615 Dial Ave
- 1515 Dogwood Dr
- 1433 Dogwood Dr
- 325 Prospect Ave
- 305 Penfield Place
- 634 S Washington Ave
- 625 Fairview Ave
- 311 Prospect Ave