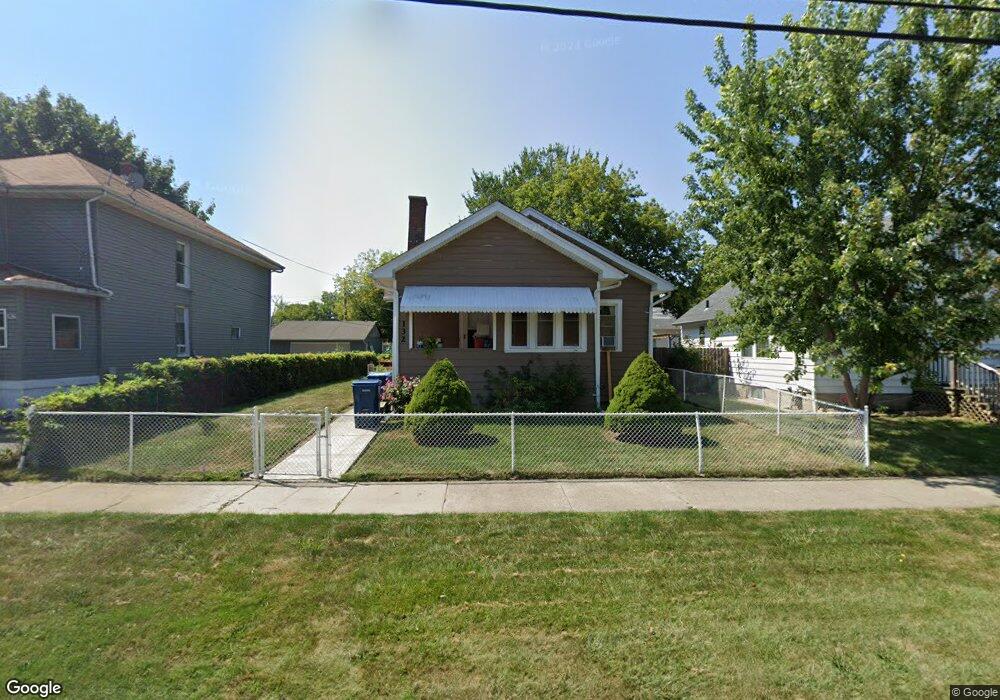
132 S Butrick St Waukegan, IL 60085
West Waukegan NeighborhoodEstimated Value: $178,000 - $213,000
2
Beds
1
Bath
1,072
Sq Ft
$189/Sq Ft
Est. Value
About This Home
This home is located at 132 S Butrick St, Waukegan, IL 60085 and is currently estimated at $202,503, approximately $188 per square foot. 132 S Butrick St is a home located in Lake County with nearby schools including Washington Elementary School, Robert E. Abbott Middle School, and Waukegan High School.
Ownership History
Date
Name
Owned For
Owner Type
Purchase Details
Closed on
Jun 5, 2003
Sold by
Chavez Enedino O and Carrera Juan A
Bought by
Cervantes Ausencio and Cervantes Jose Luis
Current Estimated Value
Home Financials for this Owner
Home Financials are based on the most recent Mortgage that was taken out on this home.
Original Mortgage
$133,371
Outstanding Balance
$58,126
Interest Rate
5.71%
Mortgage Type
FHA
Estimated Equity
$144,377
Purchase Details
Closed on
Apr 28, 2000
Sold by
Zires Luis and Zires Rosemary
Bought by
Carrera Juan O and Chavez Enedino O
Home Financials for this Owner
Home Financials are based on the most recent Mortgage that was taken out on this home.
Original Mortgage
$99,182
Interest Rate
8.21%
Mortgage Type
FHA
Purchase Details
Closed on
Aug 11, 1999
Sold by
Family Mtg Service Corp #13
Bought by
Zires Luis and Zires Rosemary
Create a Home Valuation Report for This Property
The Home Valuation Report is an in-depth analysis detailing your home's value as well as a comparison with similar homes in the area
Home Values in the Area
Average Home Value in this Area
Purchase History
| Date | Buyer | Sale Price | Title Company |
|---|---|---|---|
| Cervantes Ausencio | $135,500 | First American Title Insuran | |
| Carrera Juan O | $100,000 | -- | |
| Zires Luis | $55,000 | -- |
Source: Public Records
Mortgage History
| Date | Status | Borrower | Loan Amount |
|---|---|---|---|
| Open | Cervantes Ausencio | $133,371 | |
| Previous Owner | Carrera Juan O | $99,182 |
Source: Public Records
Tax History Compared to Growth
Tax History
| Year | Tax Paid | Tax Assessment Tax Assessment Total Assessment is a certain percentage of the fair market value that is determined by local assessors to be the total taxable value of land and additions on the property. | Land | Improvement |
|---|---|---|---|---|
| 2024 | $3,442 | $49,745 | $8,867 | $40,878 |
| 2023 | $3,252 | $44,498 | $7,932 | $36,566 |
| 2022 | $3,252 | $39,260 | $7,041 | $32,219 |
| 2021 | $2,801 | $32,868 | $6,056 | $26,812 |
| 2020 | $2,791 | $30,621 | $5,642 | $24,979 |
| 2019 | $2,756 | $28,059 | $5,170 | $22,889 |
| 2018 | $2,252 | $23,801 | $7,318 | $16,483 |
| 2017 | $2,142 | $21,057 | $6,474 | $14,583 |
| 2016 | $1,900 | $18,298 | $5,626 | $12,672 |
| 2015 | $1,753 | $16,377 | $5,035 | $11,342 |
| 2014 | $2,418 | $19,833 | $5,111 | $14,722 |
| 2012 | $3,217 | $21,487 | $5,538 | $15,949 |
Source: Public Records
Map
Nearby Homes
- 1521 Catalpa Ave
- 446 S Jackson St
- 1416 Hamilton Ct
- 304 Powell Ave
- 49 S Lewis Ave
- 23 N Jackson St
- 305 Besley Place
- 408 Besley Place
- 132 Dorchester Ct
- 613 Clarke Ave
- 610 Bluff St
- 215 S Park Ave
- 613 Washington St
- 557 W Water St
- 28 N Saint James St
- 910 Cummings Ave
- 600 Sunderlin St
- 502 Belvidere Rd
- 522 George Ave
- 515 George Ave
- 136 S Butrick St
- 124 S Butrick St
- 1409 Laurel Ave
- 138 S Butrick St
- 120 S Butrick St
- 1411 Laurel Ave
- 142 S Butrick St
- 1415 Laurel Ave
- 1416 Melrose Ave
- 129 S Butrick St
- 1419 Laurel Ave
- 127 S Butrick St
- 144 S Butrick St
- 125 S Butrick St
- 139 S Butrick St
- 1420 Melrose Ave
- 1425 Laurel Ave
- 1410 Laurel Ave
- 112 S Butrick St
- 117 S Butrick St