
Landlord's Agent in 2015
Kendall Butler
F.L.I. Properties
(706) 333-0680
234 Total Sales
Estimated Value: $210,074 - $261,000
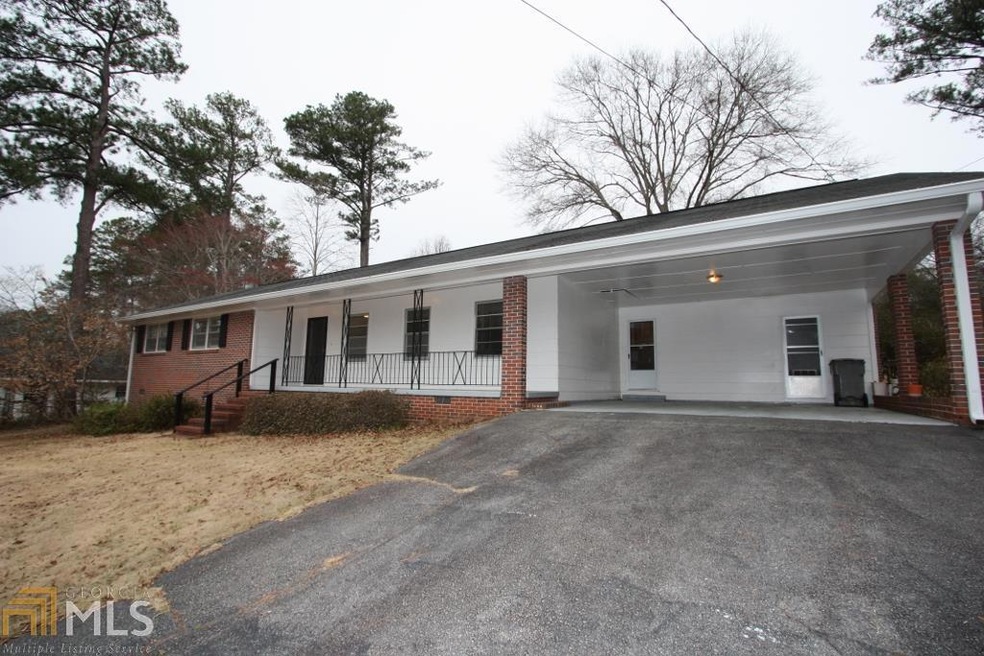
Wonderful 3 bed 2 bath with hardwoods throughout, large living room, separate dining room, eat-in kitchen, laundry room and sunroom, storage available for additional storage, nice back yard. Won't last long! Call today.
Last Agent to Rent the Property
F.L.I. Properties License #278198 Listed on: 03/19/2015
| Date | Buyer | Sale Price | Title Company |
|---|---|---|---|
| Carter David L | -- | -- | |
| Carter David L | $105,000 | -- | |
| Payne Angela Jane | -- | -- | |
| Anderson B J | $110,000 | -- | |
| Anderson B J | $110,000 | -- | |
| Evelyn C Morris | -- | -- | |
| Morris Fred Maynard | -- | -- |
| Date | Status | Borrower | Loan Amount |
|---|---|---|---|
| Previous Owner | Carter David L | $103,098 |
| Date | Event | Price | List to Sale | Price per Sq Ft |
|---|---|---|---|---|
| 03/19/2015 03/19/15 | Rented | $900 | 0.0% | -- |
| 03/19/2015 03/19/15 | For Rent | $900 | -- | -- |
| Year | Tax Paid | Tax Assessment Tax Assessment Total Assessment is a certain percentage of the fair market value that is determined by local assessors to be the total taxable value of land and additions on the property. | Land | Improvement |
|---|---|---|---|---|
| 2025 | $2,061 | $81,680 | $8,080 | $73,600 |
| 2024 | $1,857 | $70,080 | $8,080 | $62,000 |
| 2023 | $1,516 | $57,560 | $8,080 | $49,480 |
| 2022 | $1,486 | $55,240 | $8,080 | $47,160 |
| 2021 | $1,228 | $42,720 | $8,080 | $34,640 |
| 2020 | $1,228 | $42,720 | $8,080 | $34,640 |
| 2019 | $1,190 | $41,440 | $8,080 | $33,360 |
| 2018 | $1,250 | $41,440 | $8,080 | $33,360 |
| 2017 | $949 | $31,460 | $5,940 | $25,520 |
| 2016 | $926 | $30,690 | $5,940 | $24,750 |
| 2015 | $931 | $30,832 | $6,082 | $24,750 |
| 2014 | $894 | $29,529 | $6,082 | $23,447 |
| 2013 | -- | $30,623 | $6,120 | $24,503 |
Landlord's Agent in 2015
Kendall Butler
F.L.I. Properties
(706) 333-0680
234 Total Sales
Tenant's Agent in 2015
Glenda Broker
Non-Mls Company
(800) 289-1214
Source: Georgia MLS
MLS Number: 7420805
APN: 062-4C-003-029
Disclaimer: Certain information contained herein is derived from information provided by parties other than Homes.com. All information provided is deemed reliable, but is not guaranteed to be accurate and should be independently verified.
![]() The data relating to real estate for sale on this web site comes in part from the Broker Reciprocity Program of Georgia MLS. Real estate listings held by brokerage firms other than Redfin are marked with the Broker Reciprocity logo and detailed information about them includes the name of the listing brokers. Information deemed reliable but not guaranteed. Copyright 2026 Georgia MLS. All rights reserved.
The data relating to real estate for sale on this web site comes in part from the Broker Reciprocity Program of Georgia MLS. Real estate listings held by brokerage firms other than Redfin are marked with the Broker Reciprocity logo and detailed information about them includes the name of the listing brokers. Information deemed reliable but not guaranteed. Copyright 2026 Georgia MLS. All rights reserved.
Ask me questions while you tour the home.