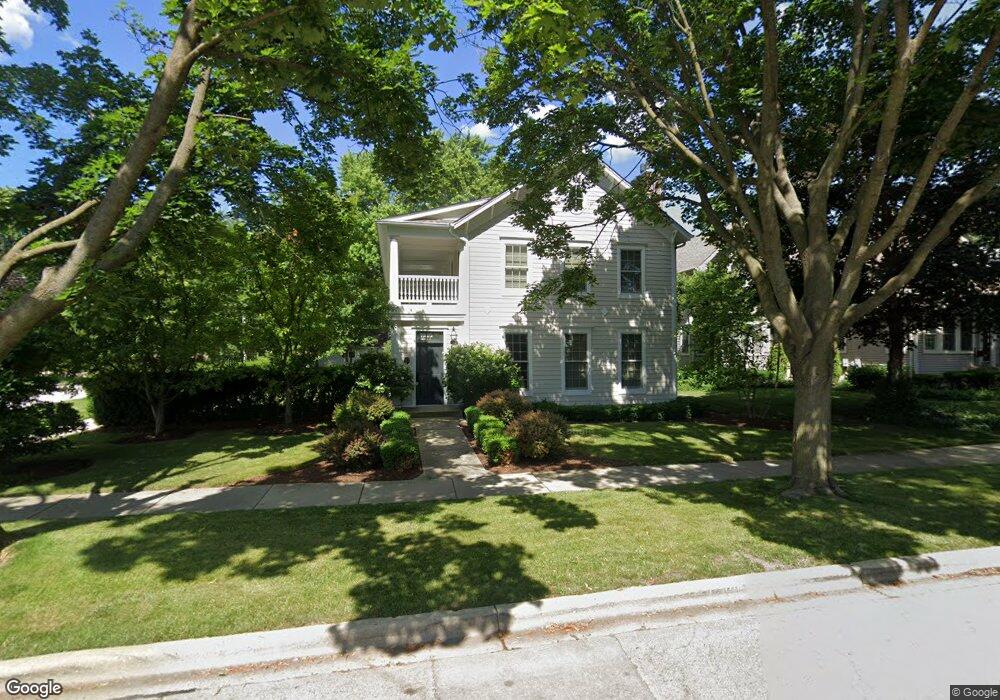
132 S Highland Ave Arlington Heights, IL 60005
Arlington Heights Central Business District NeighborhoodEstimated Value: $829,000 - $1,162,000
4
Beds
3
Baths
2,900
Sq Ft
$346/Sq Ft
Est. Value
About This Home
This home is located at 132 S Highland Ave, Arlington Heights, IL 60005 and is currently estimated at $1,004,400, approximately $346 per square foot. 132 S Highland Ave is a home located in Cook County with nearby schools including Westgate Elementary School, South Middle School, and Rolling Meadows High School.
Ownership History
Date
Name
Owned For
Owner Type
Purchase Details
Closed on
Oct 23, 2012
Sold by
Nelson Mary and Diedrich Mary
Bought by
Mitchell Mary Louise Trust and Mary Louise Mitchell Trust
Current Estimated Value
Home Financials for this Owner
Home Financials are based on the most recent Mortgage that was taken out on this home.
Original Mortgage
$562,500
Outstanding Balance
$390,247
Interest Rate
3.55%
Mortgage Type
New Conventional
Estimated Equity
$614,153
Purchase Details
Closed on
May 22, 2009
Sold by
Diedrich David and Diedrich Marylou
Bought by
Diedrich David K and Diedrich Mary Louise
Purchase Details
Closed on
Nov 15, 2004
Sold by
Snively Hugh Scott and Snively Trudi A
Bought by
Diedrich David and Diedrich Marylou
Home Financials for this Owner
Home Financials are based on the most recent Mortgage that was taken out on this home.
Original Mortgage
$262,000
Interest Rate
4.87%
Mortgage Type
Unknown
Create a Home Valuation Report for This Property
The Home Valuation Report is an in-depth analysis detailing your home's value as well as a comparison with similar homes in the area
Home Values in the Area
Average Home Value in this Area
Purchase History
| Date | Buyer | Sale Price | Title Company |
|---|---|---|---|
| Mitchell Mary Louise Trust | $230,000 | -- | |
| Mitchell Mary Louise Trust | $230,000 | -- | |
| Diedrich David K | -- | None Available | |
| Diedrich David | $330,000 | -- |
Source: Public Records
Mortgage History
| Date | Status | Borrower | Loan Amount |
|---|---|---|---|
| Open | Mitchell Mary Louise Trust | $562,500 | |
| Closed | Mitchell Mary Louise Trust | $562,500 | |
| Previous Owner | Diedrich David | $262,000 |
Source: Public Records
Tax History Compared to Growth
Tax History
| Year | Tax Paid | Tax Assessment Tax Assessment Total Assessment is a certain percentage of the fair market value that is determined by local assessors to be the total taxable value of land and additions on the property. | Land | Improvement |
|---|---|---|---|---|
| 2024 | $20,656 | $84,000 | $11,969 | $72,031 |
| 2023 | $20,524 | $84,000 | $11,969 | $72,031 |
| 2022 | $20,524 | $84,000 | $11,969 | $72,031 |
| 2021 | $16,300 | $60,145 | $6,233 | $53,912 |
| 2020 | $15,999 | $60,145 | $6,233 | $53,912 |
| 2019 | $15,887 | $66,680 | $6,233 | $60,447 |
| 2018 | $15,858 | $60,526 | $5,485 | $55,041 |
| 2017 | $15,703 | $60,526 | $5,485 | $55,041 |
| 2016 | $15,128 | $60,526 | $5,485 | $55,041 |
| 2015 | $15,000 | $55,298 | $4,737 | $50,561 |
| 2014 | $15,851 | $55,298 | $4,737 | $50,561 |
| 2013 | $6,749 | $24,152 | $4,737 | $19,415 |
Source: Public Records
Map
Nearby Homes
- 105 S Mitchell Ave
- 121 S Vail Ave Unit 403
- 121 S Vail Ave Unit 401
- 105 S Vail Ave
- 1 S Highland Ave Unit 800
- 1 S Highland Ave Unit 400
- 151 W Wing St Unit 301
- 77 S Evergreen Ave Unit 606
- 437 S Vail Ave
- 314 W Wing St
- 318 W Wing St
- 201 N Vail Ave Unit 305
- 514 W Miner St Unit 2F
- 104 N Pine Ave Unit 505
- 104 N Pine Ave Unit 302
- 32 N Belmont Ave
- 24 S Kaspar Ave
- 121 W Fremont St
- 500 E Mayfair Rd
- 222 S Dwyer Ave
- 126 S Highland Ave
- 122 S Highland Ave
- 202 S Highland Ave
- 131 S Chestnut Ave
- 125 S Chestnut Ave
- 204 S Highland Ave
- 129 S Highland Ave
- 123 S Chestnut Ave
- 133 S Highland Ave
- 219 W George St
- 201 S Highland Ave
- 125 S Highland Ave
- 121 S Highland Ave
- 114 S Highland Ave
- 205 S Chestnut Ave
- 203 S Highland Ave
- 121 S Chestnut Ave
- 121 S Chestnut Ave
- 115 S Highland Ave
- 115 S Chestnut Ave