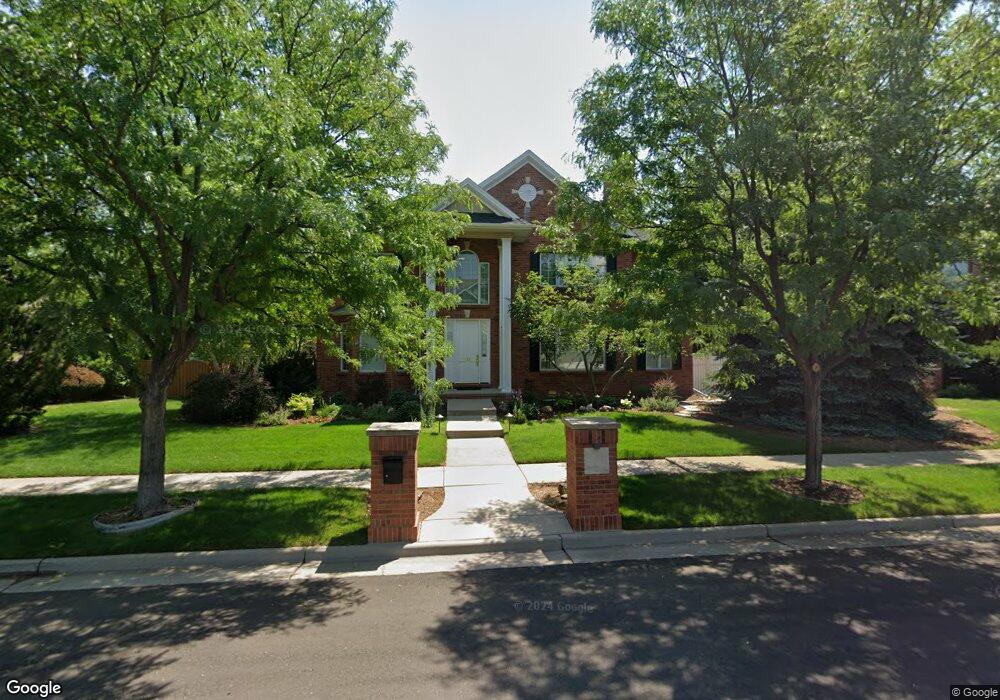
132 S Olive St Denver, CO 80230
Lowry NeighborhoodEstimated Value: $1,314,987 - $1,622,000
4
Beds
4
Baths
3,557
Sq Ft
$423/Sq Ft
Est. Value
About This Home
This home is located at 132 S Olive St, Denver, CO 80230 and is currently estimated at $1,506,247, approximately $423 per square foot. 132 S Olive St is a home located in Denver County with nearby schools including Lowry Elementary School, Hill Campus of Arts & Sciences, and George Washington High School.
Ownership History
Date
Name
Owned For
Owner Type
Purchase Details
Closed on
May 31, 2000
Sold by
Kurowski Development Co
Bought by
Blankenship R Douglas and Powell Daniel T
Current Estimated Value
Home Financials for this Owner
Home Financials are based on the most recent Mortgage that was taken out on this home.
Original Mortgage
$236,000
Outstanding Balance
$84,858
Interest Rate
8.5%
Estimated Equity
$1,421,389
Create a Home Valuation Report for This Property
The Home Valuation Report is an in-depth analysis detailing your home's value as well as a comparison with similar homes in the area
Home Values in the Area
Average Home Value in this Area
Purchase History
| Date | Buyer | Sale Price | Title Company |
|---|---|---|---|
| Blankenship R Douglas | $662,413 | -- |
Source: Public Records
Mortgage History
| Date | Status | Borrower | Loan Amount |
|---|---|---|---|
| Open | Blankenship R Douglas | $236,000 |
Source: Public Records
Tax History Compared to Growth
Tax History
| Year | Tax Paid | Tax Assessment Tax Assessment Total Assessment is a certain percentage of the fair market value that is determined by local assessors to be the total taxable value of land and additions on the property. | Land | Improvement |
|---|---|---|---|---|
| 2024 | $6,505 | $88,830 | $21,150 | $67,680 |
| 2023 | $6,364 | $88,830 | $21,150 | $67,680 |
| 2022 | $5,620 | $77,620 | $22,530 | $55,090 |
| 2021 | $5,425 | $79,860 | $23,180 | $56,680 |
| 2020 | $4,812 | $72,000 | $23,180 | $48,820 |
| 2019 | $5,192 | $72,000 | $23,180 | $48,820 |
| 2018 | $5,935 | $76,720 | $23,340 | $53,380 |
| 2017 | $5,918 | $76,720 | $23,340 | $53,380 |
| 2016 | $5,537 | $67,900 | $22,121 | $45,779 |
| 2015 | $5,305 | $67,900 | $22,121 | $45,779 |
| 2014 | $5,140 | $61,890 | $11,884 | $50,006 |
Source: Public Records
Map
Nearby Homes
- 43 S Oneida Ct
- 222 S Olive St
- 6959 E Lowry Blvd
- 10 Oneida Ct
- 18 Oneida Ct
- 6820 E Lowry Blvd
- 6758 E Lowry Blvd
- 6975 E Irvington Place
- 41 Quince St
- 65 Newport St
- 404 S Oneida Way
- 160 Poplar St Unit A
- 185 Olive St
- 209 Quebec St Unit L
- 159 Quebec St Unit D
- 435 S Olive Way
- 6435 E Cedar Ave
- 188 S Locust St
- 7702 E Maple Place Unit 7702
- 7055 E Virginia Ave
- 112 S Olive St
- 142 S Olive St
- 133 S Pontiac St
- 143 S Pontiac St
- 113 S Pontiac St
- 131 S Olive St
- 111 S Olive St
- 152 S Olive St
- 141 S Olive St
- 7015 E Bayaud Ave
- 153 S Pontiac St
- 7055 E Bayaud Ave
- 6995 E Bayaud Ave
- 151 S Olive St
- 130 S Oneida St
- 110 S Oneida St
- 172 S Olive St
- 7085 E Bayaud Ave
- 140 S Oneida St
- 114 S Pontiac St