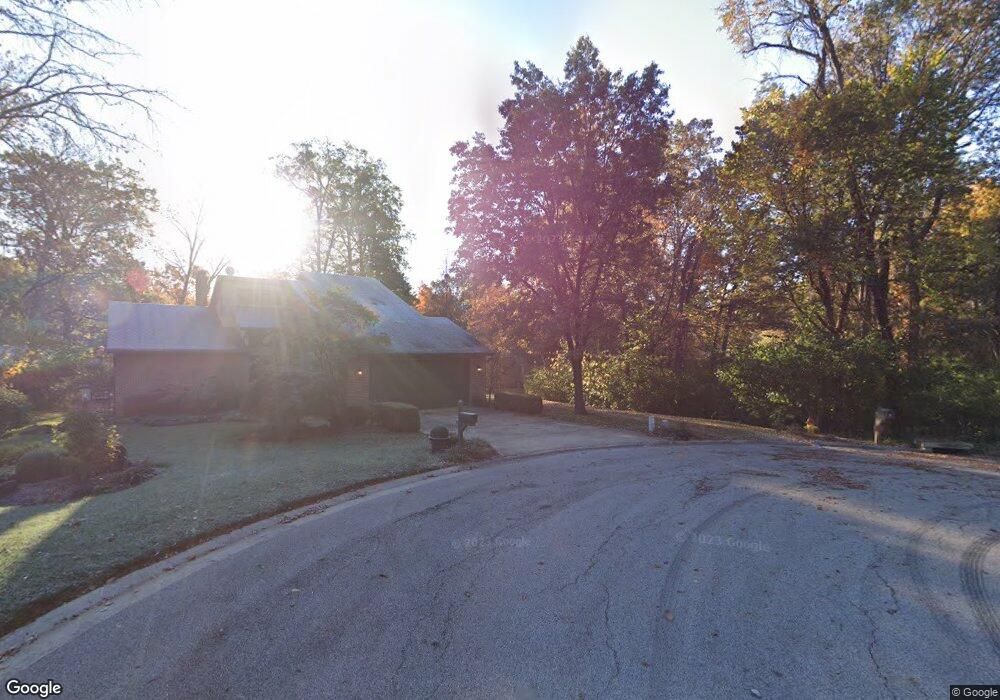
132 Sir Lawrence Dr Belleville, IL 62221
Estimated Value: $379,000 - $484,000
--
Bed
--
Bath
1,605
Sq Ft
$280/Sq Ft
Est. Value
About This Home
This home is located at 132 Sir Lawrence Dr, Belleville, IL 62221 and is currently estimated at $450,070, approximately $280 per square foot. 132 Sir Lawrence Dr is a home located in St. Clair County with nearby schools including Shiloh Elementary School, Shiloh Middle School, and O'Fallon Township High School.
Ownership History
Date
Name
Owned For
Owner Type
Purchase Details
Closed on
Oct 30, 2006
Sold by
Blanquart Robert G and Blanquart Sandra S
Bought by
Blanquart Robert G and Blanquart Sandra S
Current Estimated Value
Home Financials for this Owner
Home Financials are based on the most recent Mortgage that was taken out on this home.
Original Mortgage
$278,000
Outstanding Balance
$166,006
Interest Rate
6.38%
Mortgage Type
Purchase Money Mortgage
Estimated Equity
$284,064
Purchase Details
Closed on
Oct 25, 2006
Sold by
Rickert Robert R and Rickert Beverly A
Bought by
Blanquart Robert G and Blanquart Sandra Sue
Home Financials for this Owner
Home Financials are based on the most recent Mortgage that was taken out on this home.
Original Mortgage
$278,000
Outstanding Balance
$166,006
Interest Rate
6.38%
Mortgage Type
Purchase Money Mortgage
Estimated Equity
$284,064
Create a Home Valuation Report for This Property
The Home Valuation Report is an in-depth analysis detailing your home's value as well as a comparison with similar homes in the area
Home Values in the Area
Average Home Value in this Area
Purchase History
| Date | Buyer | Sale Price | Title Company |
|---|---|---|---|
| Blanquart Robert G | -- | None Available | |
| Blanquart Robert G | $348,000 | Town & Country Title Co |
Source: Public Records
Mortgage History
| Date | Status | Borrower | Loan Amount |
|---|---|---|---|
| Open | Blanquart Robert G | $278,000 |
Source: Public Records
Tax History Compared to Growth
Tax History
| Year | Tax Paid | Tax Assessment Tax Assessment Total Assessment is a certain percentage of the fair market value that is determined by local assessors to be the total taxable value of land and additions on the property. | Land | Improvement |
|---|---|---|---|---|
| 2024 | $9,661 | $136,306 | $29,954 | $106,352 |
| 2023 | $8,904 | $123,399 | $29,074 | $94,325 |
| 2022 | $8,519 | $114,940 | $27,081 | $87,859 |
| 2021 | $7,931 | $108,087 | $25,466 | $82,621 |
| 2020 | $8,173 | $102,012 | $24,034 | $77,978 |
| 2019 | $8,882 | $112,443 | $24,966 | $87,477 |
| 2018 | $8,715 | $109,232 | $24,253 | $84,979 |
| 2017 | $8,439 | $104,103 | $23,114 | $80,989 |
| 2016 | $8,373 | $102,122 | $22,674 | $79,448 |
| 2014 | $7,968 | $105,296 | $17,267 | $88,029 |
| 2013 | $7,774 | $106,716 | $17,500 | $89,216 |
Source: Public Records
Map
Nearby Homes
- xxxx Christine Dr
- 3416 Lebanon Ave
- 101 Montrose Ct
- 0 N Green Mount Rd
- 3536 Harbor Way
- xxxx Chippewa Dr
- 3533 Capri Ln
- Brady Plan at Indian Springs - Indian Spring
- Winchester B Plan at Indian Springs - Indian Spring
- Alexandria Plan at Indian Springs - Indian Spring
- Hannah Plan at Indian Springs - Indian Spring
- Culpepper Plan at Indian Springs - Indian Spring
- Bristol Villa Plan at Indian Springs - Indian Spring
- Bristol Plan at Indian Springs - Indian Spring
- Covington 2 Car Plan at Indian Springs - Indian Spring
- Winchester A Plan at Indian Springs - Indian Spring
- Sunrise Plan at Indian Springs - Indian Spring
- Bella Plan at Indian Springs - Indian Spring
- Covington Plan at Indian Springs - Indian Spring
- Titan Plan at Indian Springs - Indian Spring
- 201 Woods Edge Dr
- 128 Sir Lawrence Dr
- 127 Woods Edge Dr
- 207 Woods Edge Dr
- 137 Sir Lawrence Dr
- 124 Sir Lawrence Dr
- 121 Woods Edge Dr
- 213 Woods Edge Dr
- 133 Sir Lawrence Dr
- 200 Woods Edge Dr
- 120 Sir Lawrence Dr
- 125 Sir Lawrence Dr
- 122 Woods Edge Dr
- 212 Woods Edge Dr
- 121 Sir Lawrence Dr
- 219 Woods Edge Dr
- 115 Woods Edge Dr
- 3652 Willoughby Cir
- 3651 Willoughby Cir
- 116 Woods Edge Dr