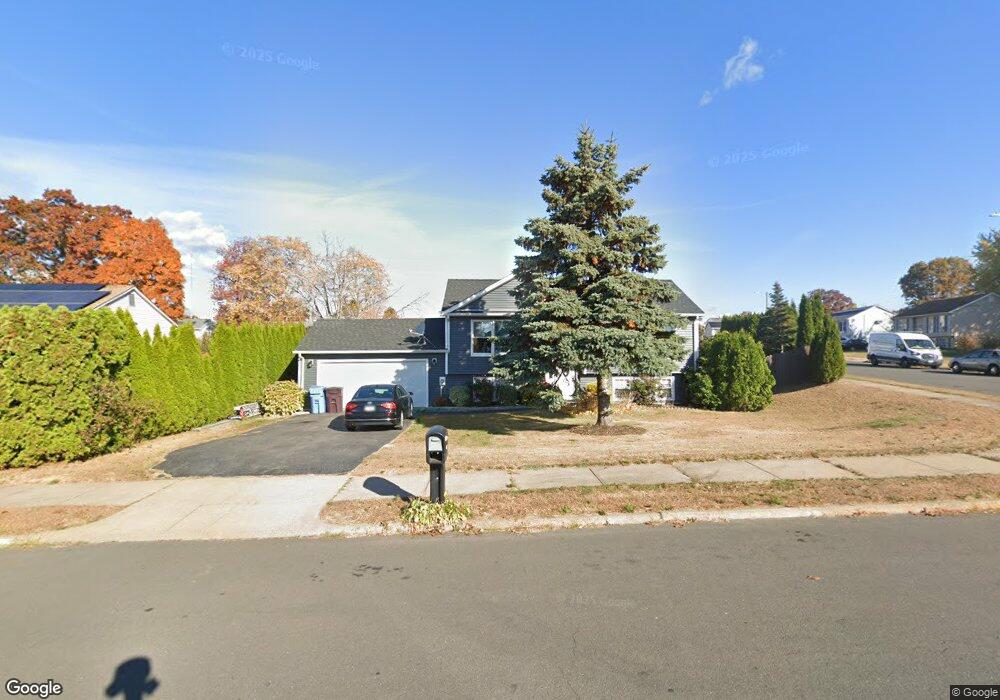
132 Skinner Dr New Britain, CT 06053
Estimated Value: $279,000 - $365,087
4
Beds
2
Baths
1,686
Sq Ft
$201/Sq Ft
Est. Value
About This Home
This home is located at 132 Skinner Dr, New Britain, CT 06053 and is currently estimated at $339,272, approximately $201 per square foot. 132 Skinner Dr is a home located in Hartford County with nearby schools including Gaffney School and Slade Middle School.
Ownership History
Date
Name
Owned For
Owner Type
Purchase Details
Closed on
Mar 12, 2008
Sold by
Department Of Housing & Urban Dev
Bought by
Leszczynski Piotr
Current Estimated Value
Home Financials for this Owner
Home Financials are based on the most recent Mortgage that was taken out on this home.
Original Mortgage
$138,000
Outstanding Balance
$85,880
Interest Rate
5.72%
Estimated Equity
$253,392
Purchase Details
Closed on
Nov 10, 2003
Sold by
Villarini Carlos E and Villarini Idalia Crespo
Bought by
Riggins Michelle C
Home Financials for this Owner
Home Financials are based on the most recent Mortgage that was taken out on this home.
Original Mortgage
$152,700
Interest Rate
6.01%
Purchase Details
Closed on
Jan 28, 1999
Sold by
Neves Nelson
Bought by
Villarini Carlos E and Villarini Idalia
Purchase Details
Closed on
Dec 19, 1989
Sold by
Slater Rd Assoc
Bought by
Neves Nelson
Create a Home Valuation Report for This Property
The Home Valuation Report is an in-depth analysis detailing your home's value as well as a comparison with similar homes in the area
Home Values in the Area
Average Home Value in this Area
Purchase History
| Date | Buyer | Sale Price | Title Company |
|---|---|---|---|
| Leszczynski Piotr | $172,500 | -- | |
| Riggins Michelle C | $154,000 | -- | |
| Villarini Carlos E | $102,500 | -- | |
| Neves Nelson | $129,900 | -- |
Source: Public Records
Mortgage History
| Date | Status | Borrower | Loan Amount |
|---|---|---|---|
| Open | Neves Nelson | $138,000 | |
| Previous Owner | Neves Nelson | $152,700 | |
| Previous Owner | Neves Nelson | $10,000 |
Source: Public Records
Tax History Compared to Growth
Tax History
| Year | Tax Paid | Tax Assessment Tax Assessment Total Assessment is a certain percentage of the fair market value that is determined by local assessors to be the total taxable value of land and additions on the property. | Land | Improvement |
|---|---|---|---|---|
| 2025 | $6,366 | $162,470 | $58,870 | $103,600 |
| 2024 | $6,432 | $162,470 | $58,870 | $103,600 |
| 2023 | $6,219 | $162,470 | $58,870 | $103,600 |
| 2022 | $5,547 | $112,070 | $27,160 | $84,910 |
| 2021 | $5,547 | $112,070 | $27,160 | $84,910 |
| 2020 | $5,553 | $109,970 | $27,160 | $82,810 |
| 2019 | $5,553 | $109,970 | $27,160 | $82,810 |
| 2018 | $5,553 | $109,970 | $27,160 | $82,810 |
| 2017 | $5,087 | $100,730 | $22,610 | $78,120 |
| 2016 | $5,087 | $100,730 | $22,610 | $78,120 |
| 2015 | $4,936 | $100,730 | $22,610 | $78,120 |
| 2014 | $4,936 | $100,730 | $22,610 | $78,120 |
Source: Public Records
Map
Nearby Homes
- 230 Hillhurst Ave
- 87 Pinehurst Ave
- 19 Maplehurst Ave
- 42 Fairlane Dr
- 1485 Corbin Ave
- 27 Candlewood Ln
- 1467 Corbin Ave
- 108 Overhill Ave
- 115 Beechwood Dr
- 95 Pierremount Ave
- 23 Ledyard Rd
- 8 Albany Ave
- 25 Clinton St
- 80 N Mountain Rd Unit B
- 76 N Mountain Rd Unit B
- 234 Pierremount Ave
- 152 Oakland Ave
- 335 Broad St
- 817 W Main St
- 148 Governor St