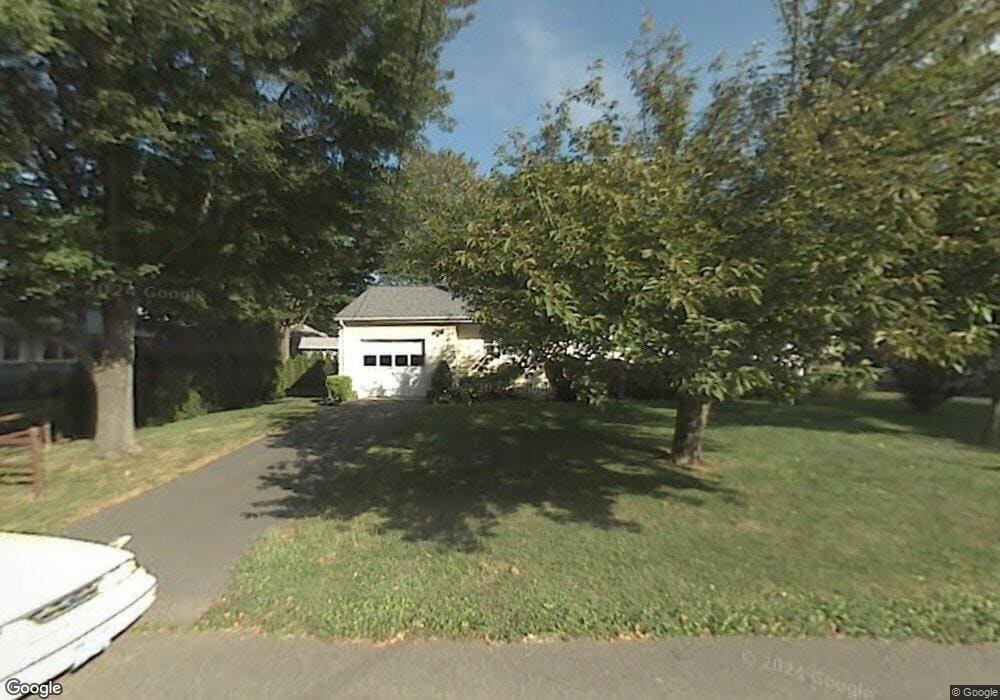
132 Sterling Ave South Plainfield, NJ 07080
Estimated Value: $500,125 - $536,000
3
Beds
1
Bath
936
Sq Ft
$558/Sq Ft
Est. Value
About This Home
This home is located at 132 Sterling Ave, South Plainfield, NJ 07080 and is currently estimated at $522,531, approximately $558 per square foot. 132 Sterling Ave is a home located in Middlesex County with nearby schools including South Plainfield High School, Holy Savior Academy, and Primrose School of North Edison.
Ownership History
Date
Name
Owned For
Owner Type
Purchase Details
Closed on
May 19, 2021
Sold by
Helly Corey
Bought by
Pace Alfred and Pace Stavroula
Current Estimated Value
Home Financials for this Owner
Home Financials are based on the most recent Mortgage that was taken out on this home.
Original Mortgage
$308,000
Interest Rate
2.96%
Mortgage Type
New Conventional
Purchase Details
Closed on
Oct 22, 2014
Sold by
Schaeffer James R and Schaeffer Jennifer
Bought by
Helly Corey
Purchase Details
Closed on
Oct 28, 2010
Sold by
Meixner Linda
Bought by
Schaeffer James R and Schaeffer Jennifer
Home Financials for this Owner
Home Financials are based on the most recent Mortgage that was taken out on this home.
Original Mortgage
$266,412
Interest Rate
4.35%
Mortgage Type
FHA
Purchase Details
Closed on
Feb 16, 2007
Sold by
Dalessio Josephine and Meixner Linda Desabato
Bought by
Desabato Marie
Create a Home Valuation Report for This Property
The Home Valuation Report is an in-depth analysis detailing your home's value as well as a comparison with similar homes in the area
Home Values in the Area
Average Home Value in this Area
Purchase History
| Date | Buyer | Sale Price | Title Company |
|---|---|---|---|
| Pace Alfred | $385,000 | Palais Title Company | |
| Helly Corey | $318,000 | Black Page Title Agency | |
| Schaeffer James R | $270,000 | None Available | |
| Desabato Marie | -- | None Available |
Source: Public Records
Mortgage History
| Date | Status | Borrower | Loan Amount |
|---|---|---|---|
| Previous Owner | Pace Alfred | $308,000 | |
| Previous Owner | Schaeffer James R | $266,412 |
Source: Public Records
Tax History Compared to Growth
Tax History
| Year | Tax Paid | Tax Assessment Tax Assessment Total Assessment is a certain percentage of the fair market value that is determined by local assessors to be the total taxable value of land and additions on the property. | Land | Improvement |
|---|---|---|---|---|
| 2025 | $6,877 | $98,500 | $35,600 | $62,900 |
| 2024 | $6,578 | $98,500 | $35,600 | $62,900 |
| 2023 | $6,578 | $98,500 | $35,600 | $62,900 |
| 2022 | $6,496 | $98,500 | $35,600 | $62,900 |
| 2021 | $6,334 | $98,500 | $35,600 | $62,900 |
| 2020 | $6,251 | $98,500 | $35,600 | $62,900 |
| 2019 | $5,998 | $98,500 | $35,600 | $62,900 |
| 2018 | $5,843 | $98,500 | $35,600 | $62,900 |
| 2017 | $5,768 | $98,500 | $35,600 | $62,900 |
| 2016 | $5,710 | $98,500 | $35,600 | $62,900 |
| 2015 | $5,612 | $94,000 | $35,600 | $58,400 |
| 2014 | $5,201 | $94,000 | $35,600 | $58,400 |
Source: Public Records
Map
Nearby Homes
- 2907 Norwood Ave
- 114 Whispering Hills Rd
- 2704 Park Ave
- 116 Whispering Hills Rd
- 114 Oakmanor Pkwy
- 205 Joan St
- 2525 Linden Ave
- 3223 Banta Rd
- 3209 Clark Ln
- 3241 Banta Rd
- 1681 Woodland Ave
- 106 Devon Ln
- 2715 Maple Ave
- 605 Oak Tree Ave
- 507 Cedarbrook Ave
- 128 Oak Tree Ave
- 1905 Park Ave
- 533 Edgar Ave
- 222 Oak Tree Ave
- 125 Redding Ave
- 130 Sterling Ave
- 1807 Norwood Ave
- 127 W Fairview Ave
- 128 Sterling Ave
- 125 W Fairview Ave
- 1801 Norwood Ave
- 131 Sterling Ave
- 133 Sterling Ave
- 2901 Norwood Ave
- 129 Sterling Ave
- 117 W Fairview Ave
- 127 Sterling Ave
- 120 Sterling Ave
- 130 Adams Ave
- 123 Sterling Ave
- 124 Adams Ave
- 128 W Fairview Ave
- 421 Norwood Ave
- 124 W Fairview Ave
- 111 W Fairview Ave