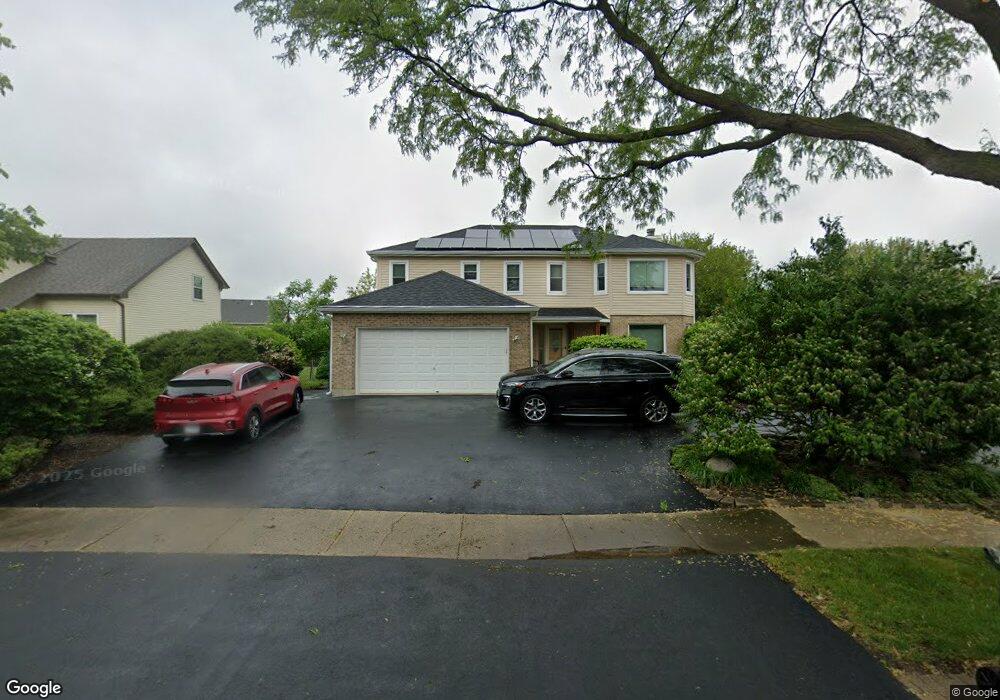
132 Wedgewood Way Bolingbrook, IL 60440
East Bolingbrook NeighborhoodEstimated Value: $390,000 - $428,000
--
Bed
--
Bath
3,021
Sq Ft
$134/Sq Ft
Est. Value
About This Home
This home is located at 132 Wedgewood Way, Bolingbrook, IL 60440 and is currently estimated at $403,370, approximately $133 per square foot. 132 Wedgewood Way is a home located in Will County with nearby schools including Jonas E Salk Elementary School, Brooks Middle School, and Hubert H Humphrey Middle School.
Ownership History
Date
Name
Owned For
Owner Type
Purchase Details
Closed on
Aug 27, 2010
Sold by
Krygsheld Faye M and Krygsheld Clarence H
Bought by
Krygsheld Faye M and Krygsheld Clarence H
Current Estimated Value
Home Financials for this Owner
Home Financials are based on the most recent Mortgage that was taken out on this home.
Original Mortgage
$346,627
Outstanding Balance
$214,138
Interest Rate
4.08%
Mortgage Type
FHA
Estimated Equity
$189,232
Purchase Details
Closed on
Apr 28, 2008
Sold by
Krygsheld Clarence H and Krygsheld Faye M
Bought by
Krygsheld Faye M and Krygsheld Clarence H
Purchase Details
Closed on
Feb 14, 2008
Sold by
Krygsheld Faye M and Krygsheld Clarence H
Bought by
Krygsheld Clarence H and Krygsheld Faye M
Purchase Details
Closed on
Feb 12, 2007
Sold by
Krygsheld Clarence and Krygsheld Faye Muriel
Bought by
Krygsheld Faye M and Krygsheld Clarence H
Purchase Details
Closed on
Oct 7, 1988
Bought by
Krygsheld Faye M
Create a Home Valuation Report for This Property
The Home Valuation Report is an in-depth analysis detailing your home's value as well as a comparison with similar homes in the area
Home Values in the Area
Average Home Value in this Area
Purchase History
| Date | Buyer | Sale Price | Title Company |
|---|---|---|---|
| Krygsheld Faye M | -- | Multiple | |
| Krygsheld Faye M | -- | None Available | |
| Krygsheld Clarence H | -- | None Available | |
| Krygsheld Faye M | -- | None Available | |
| Krygsheld Faye M | $159,000 | -- |
Source: Public Records
Mortgage History
| Date | Status | Borrower | Loan Amount |
|---|---|---|---|
| Open | Krygsheld Faye M | $346,627 |
Source: Public Records
Tax History Compared to Growth
Tax History
| Year | Tax Paid | Tax Assessment Tax Assessment Total Assessment is a certain percentage of the fair market value that is determined by local assessors to be the total taxable value of land and additions on the property. | Land | Improvement |
|---|---|---|---|---|
| 2024 | $11,396 | $141,391 | $20,174 | $121,217 |
| 2023 | $11,396 | $127,219 | $18,152 | $109,067 |
| 2022 | $10,250 | $114,694 | $16,365 | $98,329 |
| 2021 | $9,689 | $107,241 | $15,302 | $91,939 |
| 2020 | $9,378 | $103,715 | $14,799 | $88,916 |
| 2019 | $9,056 | $98,776 | $14,094 | $84,682 |
| 2018 | $8,297 | $90,879 | $12,967 | $77,912 |
| 2017 | $7,876 | $86,141 | $12,291 | $73,850 |
| 2016 | $7,625 | $82,000 | $11,700 | $70,300 |
| 2015 | $6,289 | $76,400 | $10,900 | $65,500 |
| 2014 | $6,289 | $69,400 | $9,900 | $59,500 |
| 2013 | $6,289 | $69,400 | $9,900 | $59,500 |
Source: Public Records
Map
Nearby Homes
- 124 Wedgewood Way
- 458 Ridge Ln
- 492 Ridge Ln
- 490 Ridge Ln
- 488 Ridge Ln
- 462 Ridge Ln
- Kenmore Plan at Bluebell Ridge
- Lockwood Plan at Bluebell Ridge
- 109 Arrowhead Ln
- 181 W Robinhood Way Unit 5
- 220 Falcon Ridge Way
- 460 Michelangelo Dr
- 233 Malibu Dr Unit 4
- 424 Van Gogh Cir Unit 1
- 308 Pacific Dr
- 112 Brook Ct
- 514 Jill Ln
- 6 Allegheny Ct
- 316 Bedford Rd
- 208 Porter Ln
- 136 Wedgewood Way
- 140 Wedgewood Way
- 417 Bluebell Dr
- 131 Wedgewood Way
- 415 Bluebell Dr
- 135 Wedgewood Way
- 421 Bluebell Dr
- 127 Wedgewood Way Unit 1
- 137 Barbers Corner Rd
- 413 Bluebell Dr
- 423 Bluebell Dr
- 139 Wedgewood Way
- 411 Bluebell Dr
- 120 Wedgewood Way
- 123 Wedgewood Way
- 133 Barbers Corner Rd
- 131 Barbers Corner Rd
- 409 Bluebell Dr
- 143 Wedgewood Way
- 425 Bluebell Dr