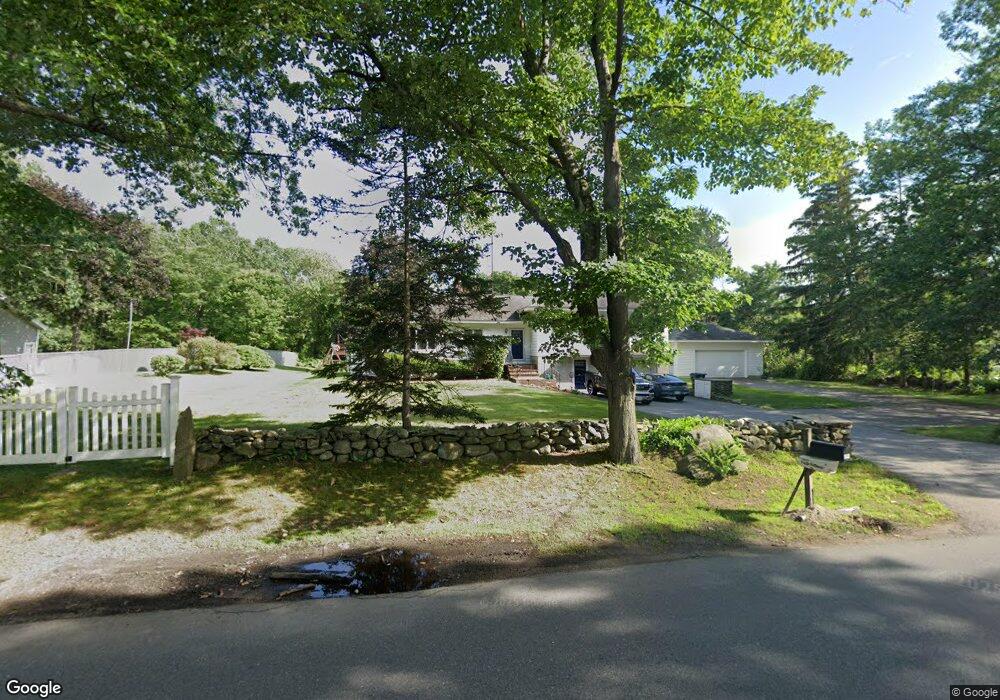
132 West St Methuen, MA 01844
The West End NeighborhoodEstimated Value: $706,000 - $798,000
4
Beds
2
Baths
2,890
Sq Ft
$260/Sq Ft
Est. Value
About This Home
This home is located at 132 West St, Methuen, MA 01844 and is currently estimated at $752,704, approximately $260 per square foot. 132 West St is a home located in Essex County with nearby schools including Marsh Grammar School, South Point Elementary School, and Methuen High School.
Ownership History
Date
Name
Owned For
Owner Type
Purchase Details
Closed on
Oct 1, 1993
Sold by
Ge Capital Mtg Service
Bought by
Lugli William L
Current Estimated Value
Purchase Details
Closed on
Jul 20, 1988
Sold by
Dumond Robert W
Bought by
Hajj George C
Create a Home Valuation Report for This Property
The Home Valuation Report is an in-depth analysis detailing your home's value as well as a comparison with similar homes in the area
Home Values in the Area
Average Home Value in this Area
Purchase History
| Date | Buyer | Sale Price | Title Company |
|---|---|---|---|
| Lugli William L | $120,000 | -- | |
| Lugli William L | $120,000 | -- | |
| Hajj George C | $160,000 | -- |
Source: Public Records
Mortgage History
| Date | Status | Borrower | Loan Amount |
|---|---|---|---|
| Open | Hajj George C | $210,000 | |
| Closed | Hajj George C | $110,000 | |
| Closed | Hajj George C | $20,000 |
Source: Public Records
Tax History Compared to Growth
Tax History
| Year | Tax Paid | Tax Assessment Tax Assessment Total Assessment is a certain percentage of the fair market value that is determined by local assessors to be the total taxable value of land and additions on the property. | Land | Improvement |
|---|---|---|---|---|
| 2025 | $6,564 | $620,400 | $297,200 | $323,200 |
| 2024 | $6,460 | $594,800 | $271,100 | $323,700 |
| 2023 | $6,120 | $523,100 | $241,000 | $282,100 |
| 2022 | $5,870 | $449,800 | $200,800 | $249,000 |
| 2021 | $5,516 | $418,200 | $190,800 | $227,400 |
| 2020 | $5,510 | $410,000 | $190,800 | $219,200 |
| 2019 | $5,223 | $368,100 | $170,700 | $197,400 |
| 2018 | $5,107 | $357,900 | $170,700 | $187,200 |
| 2017 | $5,119 | $349,400 | $170,700 | $178,700 |
| 2016 | $4,950 | $334,200 | $160,600 | $173,600 |
| 2015 | $4,879 | $334,200 | $160,600 | $173,600 |
Source: Public Records
Map
Nearby Homes