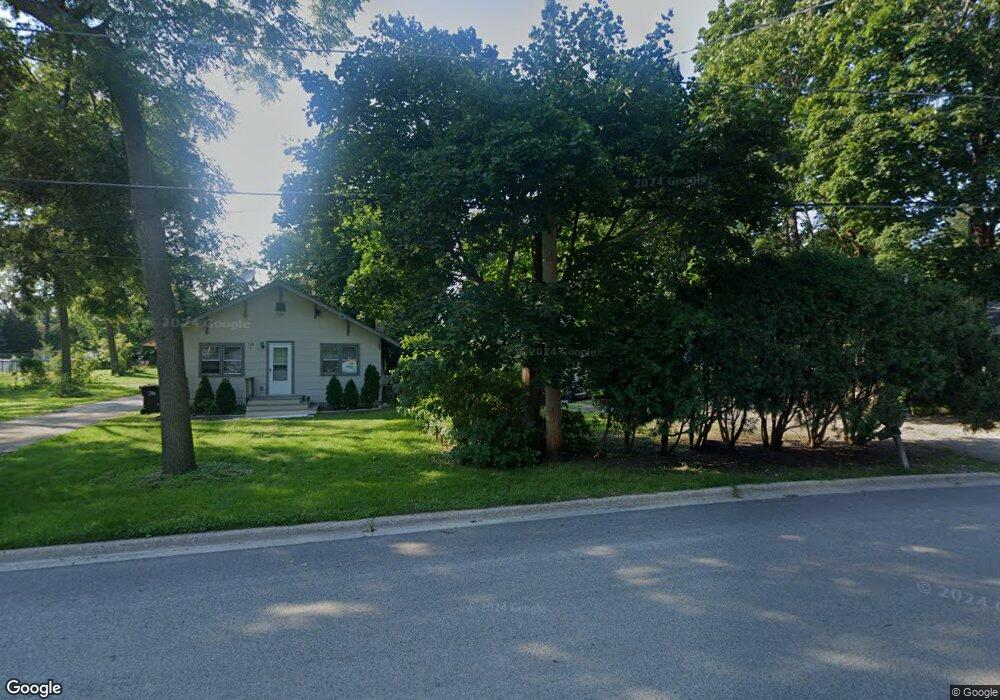
132 Wilson Ave Wauconda, IL 60084
Estimated Value: $198,000 - $298,000
--
Bed
2
Baths
1,456
Sq Ft
$183/Sq Ft
Est. Value
About This Home
This home is located at 132 Wilson Ave, Wauconda, IL 60084 and is currently estimated at $265,951, approximately $182 per square foot. 132 Wilson Ave is a home located in Lake County with nearby schools including Wauconda Grade School, Wauconda Middle School, and Wauconda High School.
Ownership History
Date
Name
Owned For
Owner Type
Purchase Details
Closed on
Dec 18, 2018
Sold by
Olsen Michael and Olsen Michael B
Bought by
Summer Property Management Ltd
Current Estimated Value
Purchase Details
Closed on
Mar 30, 2007
Sold by
Olson Michael and Olsen Michael
Bought by
Summer Property Management Ltd
Purchase Details
Closed on
Mar 20, 2002
Sold by
Swanson Glenn and Swanson Nancy
Bought by
Olson Michael
Home Financials for this Owner
Home Financials are based on the most recent Mortgage that was taken out on this home.
Original Mortgage
$230,000
Interest Rate
7%
Purchase Details
Closed on
Mar 15, 2002
Sold by
Wavra Victor V
Bought by
Swanson Glenn
Home Financials for this Owner
Home Financials are based on the most recent Mortgage that was taken out on this home.
Original Mortgage
$230,000
Interest Rate
7%
Create a Home Valuation Report for This Property
The Home Valuation Report is an in-depth analysis detailing your home's value as well as a comparison with similar homes in the area
Home Values in the Area
Average Home Value in this Area
Purchase History
| Date | Buyer | Sale Price | Title Company |
|---|---|---|---|
| Summer Property Management Ltd | -- | Attorney | |
| Summer Property Management Ltd | -- | Chicago Title Insurance Co | |
| Olson Michael | $115,000 | -- | |
| Swanson Glenn | $105,000 | -- |
Source: Public Records
Mortgage History
| Date | Status | Borrower | Loan Amount |
|---|---|---|---|
| Previous Owner | Olson Michael | $230,000 |
Source: Public Records
Tax History Compared to Growth
Tax History
| Year | Tax Paid | Tax Assessment Tax Assessment Total Assessment is a certain percentage of the fair market value that is determined by local assessors to be the total taxable value of land and additions on the property. | Land | Improvement |
|---|---|---|---|---|
| 2024 | $7,133 | $79,425 | $19,833 | $59,592 |
| 2023 | $7,049 | $72,601 | $18,129 | $54,472 |
| 2022 | $7,049 | $64,598 | $16,073 | $48,525 |
| 2021 | $6,756 | $61,040 | $15,188 | $45,852 |
| 2020 | $6,564 | $58,178 | $14,476 | $43,702 |
| 2019 | $5,851 | $54,983 | $13,681 | $41,302 |
| 2018 | $5,167 | $44,922 | $16,086 | $28,836 |
| 2017 | $5,204 | $44,403 | $15,900 | $28,503 |
| 2016 | $5,140 | $44,348 | $15,057 | $29,291 |
| 2015 | $4,868 | $40,713 | $13,823 | $26,890 |
| 2014 | $5,280 | $44,324 | $16,108 | $28,216 |
| 2012 | $5,109 | $45,221 | $15,411 | $29,810 |
Source: Public Records
Map
Nearby Homes
- 25721 W Lakeview Ave
- 300 Barrington Rd
- 107 Hammond Ave
- 25586 W High St
- 25578 W High St
- 25570 W High St
- 146 E Mill St
- 131 E Mill St Unit B104
- 125 E Mill St Unit D103
- 325 Sundown Ct Unit B
- 136 Hubbard Ct
- 25235 W Hermosa Ave
- 315 Hill St Unit A
- 303 Stillwater Ct Unit 1106
- 309 Stillwater Ct Unit 1101
- 26587 N Cherrywood Ln
- 450 N Main St Unit S307A
- 450 N Main St Unit S208A
- 26220 N Hill Ave
- 311 Brown St
- 132 Wilson Ave Unit B
- 126 Wilson Ave
- 134 Wilson Ave
- 120 Wilson Ave
- 132 Lakeview Ave
- 130 Lakeview Ave
- 403 Hammond Ave
- 403 Hammond St
- 134 Lakeview Ave
- 201 Wilson Ave
- 137 Wilson Ave
- 112 Wilson Ave
- 128 Lakeview Ave
- 121 Wilson Ave
- 25747 W Wilson Ave
- 123 Wilson Ave
- 125 Wilson Ave
- 203 Wilson Ave
- 402 Hammond Ave
- 25731 W Wilson Ave