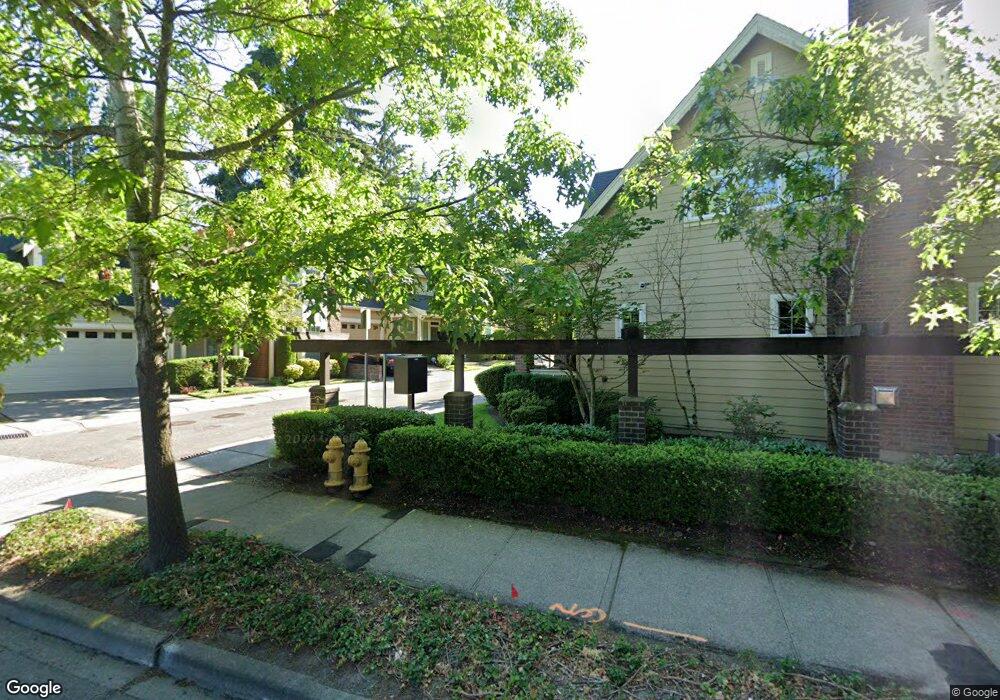
1320 Bellevue Way SE Unit 21334 Bellevue, WA 98004
Southwest Bellevue NeighborhoodEstimated Value: $1,286,000 - $1,539,000
2
Beds
3
Baths
1,834
Sq Ft
$761/Sq Ft
Est. Value
About This Home
This home is located at 1320 Bellevue Way SE Unit 21334, Bellevue, WA 98004 and is currently estimated at $1,395,667, approximately $760 per square foot. 1320 Bellevue Way SE Unit 21334 is a home located in King County with nearby schools including Enatai Elementary School, Chinook Middle School, and Bellevue High School.
Ownership History
Date
Name
Owned For
Owner Type
Purchase Details
Closed on
Oct 31, 2016
Sold by
Tepper Lloyd
Bought by
Moon Wonjong and Chang Heejin
Current Estimated Value
Home Financials for this Owner
Home Financials are based on the most recent Mortgage that was taken out on this home.
Original Mortgage
$300,000
Outstanding Balance
$241,303
Interest Rate
3.48%
Mortgage Type
New Conventional
Estimated Equity
$1,154,364
Purchase Details
Closed on
Apr 8, 2015
Sold by
Foster David D
Bought by
Tepper Lloyd
Purchase Details
Closed on
Oct 13, 2005
Sold by
Camwest Development Inc
Bought by
Foster David D
Home Financials for this Owner
Home Financials are based on the most recent Mortgage that was taken out on this home.
Original Mortgage
$504,361
Interest Rate
5.63%
Mortgage Type
Fannie Mae Freddie Mac
Create a Home Valuation Report for This Property
The Home Valuation Report is an in-depth analysis detailing your home's value as well as a comparison with similar homes in the area
Home Values in the Area
Average Home Value in this Area
Purchase History
| Date | Buyer | Sale Price | Title Company |
|---|---|---|---|
| Moon Wonjong | $855,000 | Chicago Title | |
| Tepper Lloyd | $825,000 | Chicago Title | |
| Foster David D | $630,451 | Transnation Ti |
Source: Public Records
Mortgage History
| Date | Status | Borrower | Loan Amount |
|---|---|---|---|
| Open | Moon Wonjong | $300,000 | |
| Previous Owner | Foster David D | $504,361 |
Source: Public Records
Tax History Compared to Growth
Tax History
| Year | Tax Paid | Tax Assessment Tax Assessment Total Assessment is a certain percentage of the fair market value that is determined by local assessors to be the total taxable value of land and additions on the property. | Land | Improvement |
|---|---|---|---|---|
| 2024 | $9,653 | $1,315,000 | $278,000 | $1,037,000 |
| 2023 | $9,118 | $1,533,000 | $278,000 | $1,255,000 |
| 2022 | $9,120 | $1,287,000 | $278,000 | $1,009,000 |
| 2021 | $8,748 | $1,110,000 | $254,800 | $855,200 |
| 2020 | $9,037 | $987,000 | $254,800 | $732,200 |
| 2018 | $8,122 | $980,000 | $208,500 | $771,500 |
| 2017 | $7,111 | $882,000 | $185,300 | $696,700 |
| 2016 | $5,889 | $814,000 | $185,300 | $628,700 |
| 2015 | $6,036 | $669,000 | $162,200 | $506,800 |
| 2014 | -- | $679,000 | $162,200 | $516,800 |
| 2013 | -- | $552,000 | $162,200 | $389,800 |
Source: Public Records
Map
Nearby Homes
- 1400 Bellevue Way SE Unit 4
- 1420 Bellevue Way SE Unit 5
- 1606 106th Ave SE
- 10823 SE 12th St
- 1646 106th Ave SE
- 814 844 Bellevue Way SE
- 1630 104th Ave SE
- 10230 SE 13th Place
- 10789 SE 10th St
- 815 108th Ave SE
- 955 103rd Ave SE
- 909 110th Ave SE
- 204 Northside Rd
- 10250 SE 21st St
- 621 Bellevue Way SE
- 1815 102nd Place SE
- 209 Northside Rd
- 600 Bellevue Way SE Unit J301
- 10425 SE 22nd St
- 10320 SE 6th St Unit B6
- 1320 Bellevue Way SE
- 1320 Bellevue Way SE Unit 1348
- 1320 Bellevue Way SE Unit 1346
- 1320 Bellevue Way SE Unit 1342
- 1320 Bellevue Way SE Unit 31320
- 1320 Bellevue Way SE Unit 21336
- 1320 Bellevue Way SE Unit 1340
- 1320 Bellevue Way SE Unit 31324
- 1320 Bellevue Way SE Unit 21338
- 1320 Bellevue Way SE Unit 21332
- 1320 Bellevue Way SE Unit 31322
- 1334 Bellevue Way SE
- 1346 Bellevue Way SE Unit 3
- 1346 Bellevue Way SE
- 1348 Bellevue Way SE Unit 1348
- 1348 Bellevue Way SE
- 1324 Bellevue Way SE
- 1340 Bellevue Way SE
- 1411 108th Ave SE