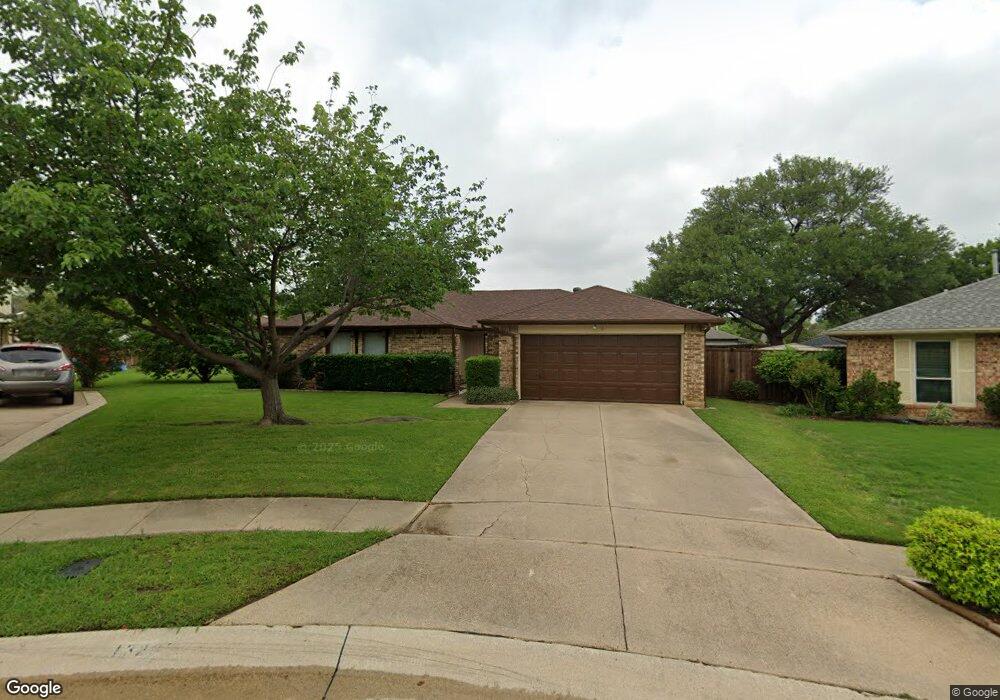
1320 Colony Ct Flower Mound, TX 75028
Prairie Creek NeighborhoodEstimated Value: $373,000 - $395,000
3
Beds
2
Baths
1,694
Sq Ft
$226/Sq Ft
Est. Value
About This Home
This home is located at 1320 Colony Ct, Flower Mound, TX 75028 and is currently estimated at $382,970, approximately $226 per square foot. 1320 Colony Ct is a home located in Denton County with nearby schools including Prairie Trail Elementary School, Lamar Middle School, and Marcus High School.
Ownership History
Date
Name
Owned For
Owner Type
Purchase Details
Closed on
Jun 8, 2020
Sold by
Dugger Cary
Bought by
Myers The Home Buyers Llc
Current Estimated Value
Purchase Details
Closed on
Sep 5, 2019
Sold by
Markel Connie L
Bought by
Markel Colony Llc
Purchase Details
Closed on
Oct 24, 2013
Sold by
Lonser Dirk and Oliver Anithia
Bought by
Markel Michael and Markel Connie
Purchase Details
Closed on
Dec 9, 2010
Sold by
Cox Charles F and Cox Paula Louise
Bought by
Lonser Dirk
Home Financials for this Owner
Home Financials are based on the most recent Mortgage that was taken out on this home.
Original Mortgage
$110,800
Interest Rate
4.22%
Mortgage Type
New Conventional
Purchase Details
Closed on
Nov 5, 1996
Sold by
Coppersmith Sally Louise
Bought by
Cox Charles F
Home Financials for this Owner
Home Financials are based on the most recent Mortgage that was taken out on this home.
Original Mortgage
$96,524
Interest Rate
7.85%
Create a Home Valuation Report for This Property
The Home Valuation Report is an in-depth analysis detailing your home's value as well as a comparison with similar homes in the area
Home Values in the Area
Average Home Value in this Area
Purchase History
| Date | Buyer | Sale Price | Title Company |
|---|---|---|---|
| Myers The Home Buyers Llc | -- | Excel Title Group Llc | |
| Markel Colony Llc | -- | None Available | |
| Markel Michael | -- | Lawyers Title | |
| Lonser Dirk | -- | Hftc | |
| Cox Charles F | -- | -- |
Source: Public Records
Mortgage History
| Date | Status | Borrower | Loan Amount |
|---|---|---|---|
| Previous Owner | Lonser Dirk | $110,800 | |
| Previous Owner | Cox Charles F | $96,524 |
Source: Public Records
Tax History Compared to Growth
Tax History
| Year | Tax Paid | Tax Assessment Tax Assessment Total Assessment is a certain percentage of the fair market value that is determined by local assessors to be the total taxable value of land and additions on the property. | Land | Improvement |
|---|---|---|---|---|
| 2025 | $5,705 | $347,000 | $86,800 | $260,200 |
| 2024 | $5,705 | $337,000 | $86,800 | $250,200 |
| 2023 | $6,333 | $371,000 | $82,276 | $288,724 |
| 2022 | $5,103 | $274,478 | $72,850 | $201,628 |
| 2021 | $4,460 | $222,000 | $49,600 | $172,400 |
| 2020 | $4,238 | $212,000 | $49,600 | $162,400 |
| 2019 | $4,351 | $210,000 | $49,600 | $160,400 |
| 2018 | $4,109 | $197,136 | $49,600 | $147,536 |
| 2017 | $3,688 | $175,000 | $49,600 | $125,400 |
| 2016 | $1,975 | $93,723 | $24,800 | $68,923 |
| 2015 | -- | $164,025 | $33,670 | $130,355 |
| 2013 | -- | $145,600 | $33,670 | $111,930 |
Source: Public Records
Map
Nearby Homes
- 5329 Ponder Place
- 5400 Carriage Ct
- 1208 Homestead St
- 5309 Buckner Dr
- 1105 Coker Dr
- 1617 Oak Creek Dr
- 4925 Marcus Dr
- 1682 Shannon Dr
- 1554 N Valley Pkwy
- 1204 Marcus Ct
- 1661 Crosshaven Dr
- 1602 Autumn Breeze Ln
- 5324 Peterson Ct
- 1613 Autumn Breeze Ln
- 1601 Autumn Breeze Ln
- 1534 Autumn Breeze Ln
- 1581 Glenmore Dr
- 5508 Frost Ln
- 1529 Springaire Ln
- 1685 Niagara Blvd
- 1324 Colony Ct
- 1316 Colony Ct
- 1325 Ponder Way
- 5212 Colonial Dr
- 1317 Ponder Way
- 5216 Colonial Dr
- 1312 Colony Ct
- 5208 Colonial Dr
- 1321 Colony Ct
- 5220 Colonial Dr
- 1313 Ponder Way
- 1319 Colony Ct
- 5204 Colonial Dr
- 1308 Colony Ct
- 1309 Ponder Way
- 1313 Colony Ct
- 1304 Colony Ct
- 1320 Ponder Way
- 1316 Ponder Way
- 1324 Ponder Way