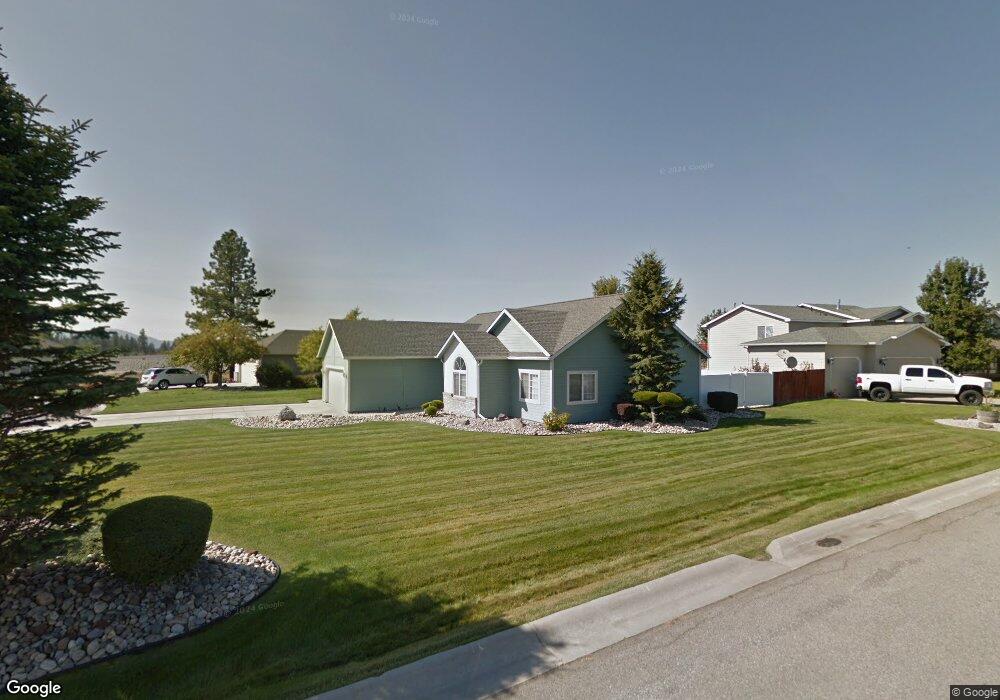
1320 E Bitteroot Ct Deer Park, WA 99006
Estimated Value: $389,952 - $438,000
3
Beds
2
Baths
1,535
Sq Ft
$266/Sq Ft
Est. Value
About This Home
This home is located at 1320 E Bitteroot Ct, Deer Park, WA 99006 and is currently estimated at $408,238, approximately $265 per square foot. 1320 E Bitteroot Ct is a home located in Spokane County with nearby schools including Deer Park Elementary School, Arcadia Elementary School, and Deer Park Home Link Program.
Ownership History
Date
Name
Owned For
Owner Type
Purchase Details
Closed on
Aug 28, 2007
Sold by
Verzal Lonna J
Bought by
Verzal Timothy A
Current Estimated Value
Home Financials for this Owner
Home Financials are based on the most recent Mortgage that was taken out on this home.
Original Mortgage
$139,600
Outstanding Balance
$89,152
Interest Rate
6.74%
Mortgage Type
Unknown
Estimated Equity
$319,086
Purchase Details
Closed on
Mar 7, 2003
Sold by
Kwon Son Ku and Kwon Hyun S
Bought by
Verzal Timothy A and Verzal Lonna J
Home Financials for this Owner
Home Financials are based on the most recent Mortgage that was taken out on this home.
Original Mortgage
$108,909
Interest Rate
5.83%
Mortgage Type
FHA
Purchase Details
Closed on
Apr 3, 1997
Sold by
G & D Investments
Bought by
Kwon Son Ku and Kwon Hyun S
Home Financials for this Owner
Home Financials are based on the most recent Mortgage that was taken out on this home.
Original Mortgage
$94,500
Interest Rate
7.66%
Create a Home Valuation Report for This Property
The Home Valuation Report is an in-depth analysis detailing your home's value as well as a comparison with similar homes in the area
Home Values in the Area
Average Home Value in this Area
Purchase History
| Date | Buyer | Sale Price | Title Company |
|---|---|---|---|
| Verzal Timothy A | $65,985 | Spokane County Title Co | |
| Verzal Timothy A | $110,700 | Spokane County Title Co | |
| Kwon Son Ku | $105,000 | Pacific Nw Title |
Source: Public Records
Mortgage History
| Date | Status | Borrower | Loan Amount |
|---|---|---|---|
| Open | Verzal Timothy A | $139,600 | |
| Previous Owner | Verzal Timothy A | $108,909 | |
| Previous Owner | Kwon Son Ku | $94,500 |
Source: Public Records
Tax History Compared to Growth
Tax History
| Year | Tax Paid | Tax Assessment Tax Assessment Total Assessment is a certain percentage of the fair market value that is determined by local assessors to be the total taxable value of land and additions on the property. | Land | Improvement |
|---|---|---|---|---|
| 2025 | $2,841 | $327,300 | $100,000 | $227,300 |
| 2024 | $2,841 | $321,800 | $100,000 | $221,800 |
| 2023 | $2,822 | $325,600 | $85,000 | $240,600 |
| 2022 | $2,550 | $313,200 | $82,000 | $231,200 |
| 2021 | $2,505 | $226,800 | $55,000 | $171,800 |
| 2020 | $2,406 | $208,600 | $52,000 | $156,600 |
| 2019 | $2,231 | $194,600 | $50,000 | $144,600 |
| 2018 | $2,251 | $180,300 | $43,000 | $137,300 |
| 2017 | $1,982 | $161,400 | $30,000 | $131,400 |
| 2016 | $1,857 | $146,300 | $30,000 | $116,300 |
| 2015 | $1,864 | $143,300 | $27,000 | $116,300 |
| 2014 | -- | $143,300 | $27,000 | $116,300 |
| 2013 | -- | $0 | $0 | $0 |
Source: Public Records
Map
Nearby Homes
- 1321 E 4th St
- 418 Washington Ave
- 414 Washington Ave
- 410 N Washington Dr
- 711 E 5th St
- 1320 E Chelan Ct
- 406 Washington Ave
- 413 Washington Ave
- The Lookout Plan at Marshall Meadows - The Debut
- The Phoenix Plan at Marshall Meadows - The Debut
- The Panhandle Plan at Marshall Meadows - The Debut
- The Raven Plan at Marshall Meadows - The Debut
- The Aspen Plan at Marshall Meadows - The Debut
- The Willow Plan at Marshall Meadows - The Debut
- The Cottonwood Plan at Marshall Meadows - The Debut
- The Clark Fork Plan at Marshall Meadows - The Debut
- The Columbia Plan at Marshall Meadows - The Debut
- The Fraser Plan at Marshall Meadows - The Debut
- The Cataldo Plan at Marshall Meadows - The Debut
- 405 Washington Ave
- 901 N High Desert Dr
- 1314 E Bitteroot Ct
- 820 High Desert Dr
- 808 High Desert Dr
- 814 N High Desert Dr
- 902 High Desert Dr
- 814 N High Desert Dr
- 907 N High Desert Dr
- 1308 E Bitteroot Ct
- 1321 E Bitteroot Ct
- 1315 E Bitteroot Ct
- 808 N High Desert Dr
- 1320 High Desert Dr
- 908 High Desert Dr
- 909 N High Desert Dr
- 907 High Desert Dr
- 802 N High Desert Dr
- 720 High Desert Dr
- 909 High Desert Dr
- 713 N High Desert Dr