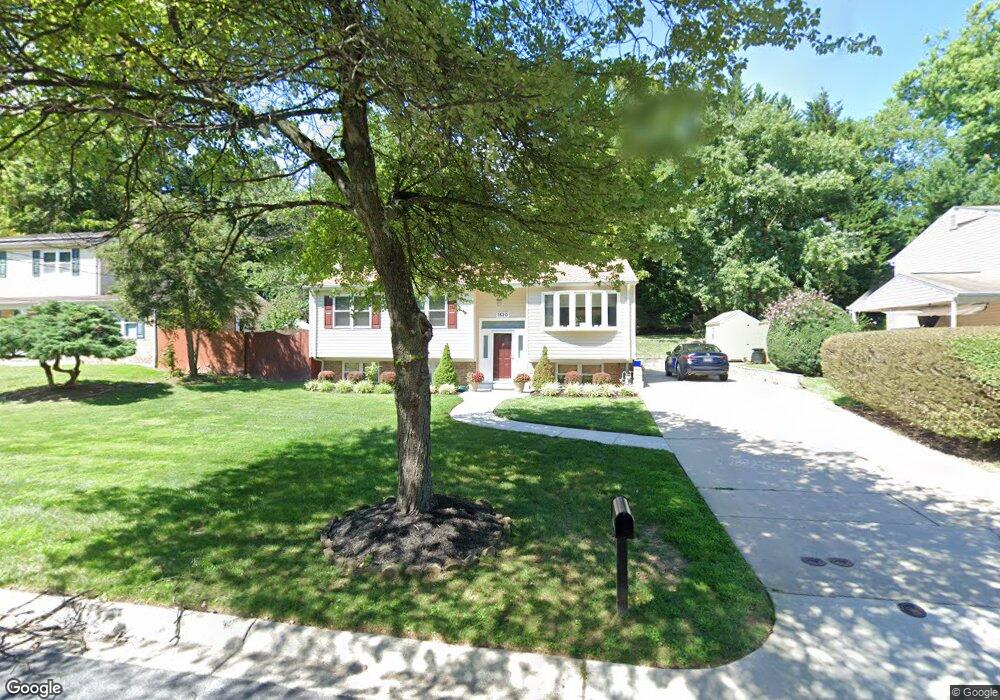
1320 Gresham Rd Silver Spring, MD 20904
Estimated Value: $562,423 - $618,000
Studio
3
Baths
1,540
Sq Ft
$392/Sq Ft
Est. Value
About This Home
This home is located at 1320 Gresham Rd, Silver Spring, MD 20904 and is currently estimated at $603,606, approximately $391 per square foot. 1320 Gresham Rd is a home located in Montgomery County with nearby schools including William Tyler Page Elementary School, Briggs Chaney Middle School, and James Hubert Blake High School.
Ownership History
Date
Name
Owned For
Owner Type
Purchase Details
Closed on
Oct 9, 2024
Sold by
Davis Shari L
Bought by
Shari L Davis Revocable Living Trust
Current Estimated Value
Purchase Details
Closed on
Dec 19, 2012
Sold by
Davis Shari and Tobias Dolores
Bought by
Davis Shari
Purchase Details
Closed on
Jun 21, 2001
Sold by
Clem Ronald E
Bought by
Davis Shari
Purchase Details
Closed on
Jul 15, 1999
Sold by
Lem Ronald E and Lem M R
Bought by
Clem Ronald E
Purchase Details
Closed on
Aug 2, 1994
Sold by
Mattix Marc E
Bought by
Clem Ronald E
Home Financials for this Owner
Home Financials are based on the most recent Mortgage that was taken out on this home.
Original Mortgage
$164,050
Interest Rate
8.25%
Create a Home Valuation Report for This Property
The Home Valuation Report is an in-depth analysis detailing your home's value as well as a comparison with similar homes in the area
Home Values in the Area
Average Home Value in this Area
Purchase History
| Date | Buyer | Sale Price | Title Company |
|---|---|---|---|
| Shari L Davis Revocable Living Trust | -- | None Listed On Document | |
| Davis Shari | -- | None Available | |
| Davis Shari | $230,000 | -- | |
| Clem Ronald E | -- | -- | |
| Clem Ronald E | $172,700 | -- |
Source: Public Records
Mortgage History
| Date | Status | Borrower | Loan Amount |
|---|---|---|---|
| Previous Owner | Clem Ronald E | $164,050 |
Source: Public Records
Tax History
| Year | Tax Paid | Tax Assessment Tax Assessment Total Assessment is a certain percentage of the fair market value that is determined by local assessors to be the total taxable value of land and additions on the property. | Land | Improvement |
|---|---|---|---|---|
| 2025 | $5,649 | $469,300 | -- | -- |
| 2024 | $5,649 | $437,900 | $0 | $0 |
| 2023 | $4,571 | $406,500 | $212,000 | $194,500 |
| 2022 | $3,154 | $391,367 | $0 | $0 |
| 2021 | $2,732 | $376,233 | $0 | $0 |
| 2020 | $3,729 | $361,100 | $212,000 | $149,100 |
| 2019 | $5,281 | $344,200 | $0 | $0 |
| 2018 | $5,108 | $327,300 | $0 | $0 |
| 2017 | $5,733 | $310,400 | $0 | $0 |
| 2016 | -- | $294,867 | $0 | $0 |
| 2015 | $3,421 | $279,333 | $0 | $0 |
| 2014 | $3,421 | $263,800 | $0 | $0 |
Source: Public Records
Map
Nearby Homes
- 1407 Northcrest Dr
- 13137 Broadmore Rd
- 1306 Leister Dr
- 2204 Badian Dr
- 3092 Fairland Rd
- 12624 Billington Rd
- 13724 Bridgewater Dr
- 816 Rosemere Ave
- 1309 Swingingdale Dr
- 13704 New Hampshire Ave
- 13707 Notley Rd
- 2124 Aventurine Way
- 0 Hidden Valley Ln
- 13711 Notley Rd
- 708 Hollywood Ave
- 13715 Notley Rd
- 13719 Notley Rd
- 906 Venice Dr
- 605 Rosemere Ave
- 2301 Starcrest Dr
- 1318 Gresham Rd
- 1322 Gresham Rd
- 1321 Mimosa Ln
- 1323 Mimosa Ln
- 1319 Mimosa Ln
- 1316 Gresham Rd
- 1324 Gresham Rd
- 1319 Gresham Rd
- 1321 Gresham Rd
- 1325 Mimosa Ln
- 1317 Gresham Rd
- 1317 Mimosa Ln
- 1323 Gresham Rd
- 1314 Gresham Rd
- 1326 Gresham Rd
- 1327 Mimosa Ln
- 1315 Mimosa Ln
- 1320 Canyon Rd
- 1325 Gresham Rd
- 1322 Canyon Rd
Your Personal Tour Guide
Ask me questions while you tour the home.