Estimated Value: $68,000 - $153,000
--
Bed
1
Bath
1,144
Sq Ft
$99/Sq Ft
Est. Value
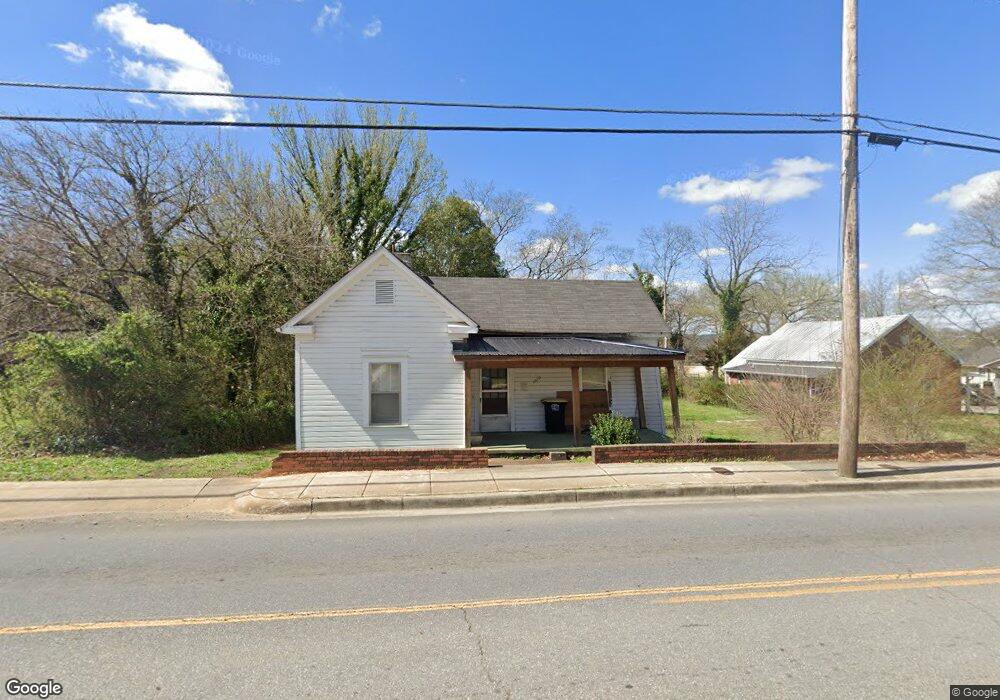
About This Home
This home is located at 1320 Maple Ave SW, Rome, GA 30161 and is currently estimated at $112,809, approximately $98 per square foot. 1320 Maple Ave SW is a home located in Floyd County with nearby schools including Dan McCarty Middle School, Rome High School, and Darlington School.
Ownership History
Date
Name
Owned For
Owner Type
Purchase Details
Closed on
Oct 26, 2011
Sold by
Davis Hiram W
Bought by
Davis Hiram W
Current Estimated Value
Purchase Details
Closed on
Feb 23, 2010
Sold by
Smith Charles A
Bought by
Davis Hiram W
Purchase Details
Closed on
Feb 8, 2010
Sold by
Fletcher Ruby
Bought by
Davis Hiram W
Purchase Details
Closed on
Jan 30, 2010
Sold by
Campbell Erica M
Bought by
Dais Hiram W
Purchase Details
Closed on
Jan 27, 2010
Sold by
Campbell Gerald
Bought by
Davis Hiram W
Purchase Details
Closed on
Jan 26, 2010
Sold by
Davis Linda
Bought by
Davis Hiram W
Purchase Details
Closed on
Jan 23, 2010
Sold by
Campbell Clarence
Bought by
Davis Hiram W
Purchase Details
Closed on
Jan 21, 2010
Sold by
Hudson Sandra
Bought by
Davis Hiram W
Purchase Details
Closed on
Jan 20, 2010
Sold by
Owens Patricia
Bought by
Davis Hiram W
Purchase Details
Closed on
Jan 1, 1901
Bought by
Davis Ethel
Create a Home Valuation Report for This Property
The Home Valuation Report is an in-depth analysis detailing your home's value as well as a comparison with similar homes in the area
Home Values in the Area
Average Home Value in this Area
Purchase History
| Date | Buyer | Sale Price | Title Company |
|---|---|---|---|
| Davis Hiram W | -- | -- | |
| Davis Hiram W | -- | -- | |
| Davis Hiram W | -- | -- | |
| Dais Hiram W | -- | -- | |
| Davis Hiram W | -- | -- | |
| Davis Hiram W | -- | -- | |
| Davis Hiram W | -- | -- | |
| Davis Hiram W | -- | -- | |
| Davis Hiram W | -- | -- | |
| Davis Ethel | -- | -- |
Source: Public Records
Tax History Compared to Growth
Tax History
| Year | Tax Paid | Tax Assessment Tax Assessment Total Assessment is a certain percentage of the fair market value that is determined by local assessors to be the total taxable value of land and additions on the property. | Land | Improvement |
|---|---|---|---|---|
| 2024 | $132 | $24,576 | $4,250 | $20,326 |
| 2023 | $133 | $23,294 | $3,864 | $19,430 |
| 2022 | $137 | $18,915 | $3,091 | $15,824 |
| 2021 | $138 | $17,034 | $3,091 | $13,943 |
| 2020 | $140 | $12,655 | $2,415 | $10,240 |
| 2019 | $138 | $11,915 | $2,415 | $9,500 |
| 2018 | $138 | $10,982 | $2,415 | $8,567 |
| 2017 | $138 | $10,533 | $2,415 | $8,118 |
| 2016 | $139 | $10,196 | $2,400 | $7,796 |
| 2015 | $119 | $9,327 | $2,400 | $6,927 |
| 2014 | $119 | $9,327 | $2,400 | $6,927 |
Source: Public Records
Map
Nearby Homes
- 4 E 15th St SW
- 1502 Spring Creek St SW
- 39 E 16th St SW
- 170 E 11th St SW
- 168 E 11th St SE
- 164 E 11th St SE
- 162 E 11th St SE
- 166 E 11th St SW
- 000 E Oglethorpe Hwy
- 106 E 14th St SW
- 2 E 10th St SW
- 31 Notasulga Dr SW
- 1705 Olmstead St SW
- 414 E 17th St SW
- 9 Eastridge Ct SW
- 304 E 19th St SW
- 1901 Hull Ave SW
- 316 S McLin St SW
- 1314 E 2nd Ave SE
- 1318 Maple Ave SW
- 118 Holder St SW
- 116 Holder St SW
- 1316 Maple Ave SW
- 0 E 14th St Unit 20167344
- 0 E 14th St Unit 20167530
- 0 E 14th St
- 410 E 14th St
- 216 E 14th St
- 120 Holder St SW
- 122 Holder St SW
- 215 E 14th St SW
- 1326 Maple Ave SW
- 1314 Maple Ave SW
- 1315 Maple Ave SW
- 117 Holder St SW
- 119 Holder St SW
- 119 Holder St SW Unit B
- 119 Holder St SW Unit A
- 119 Holder St SW