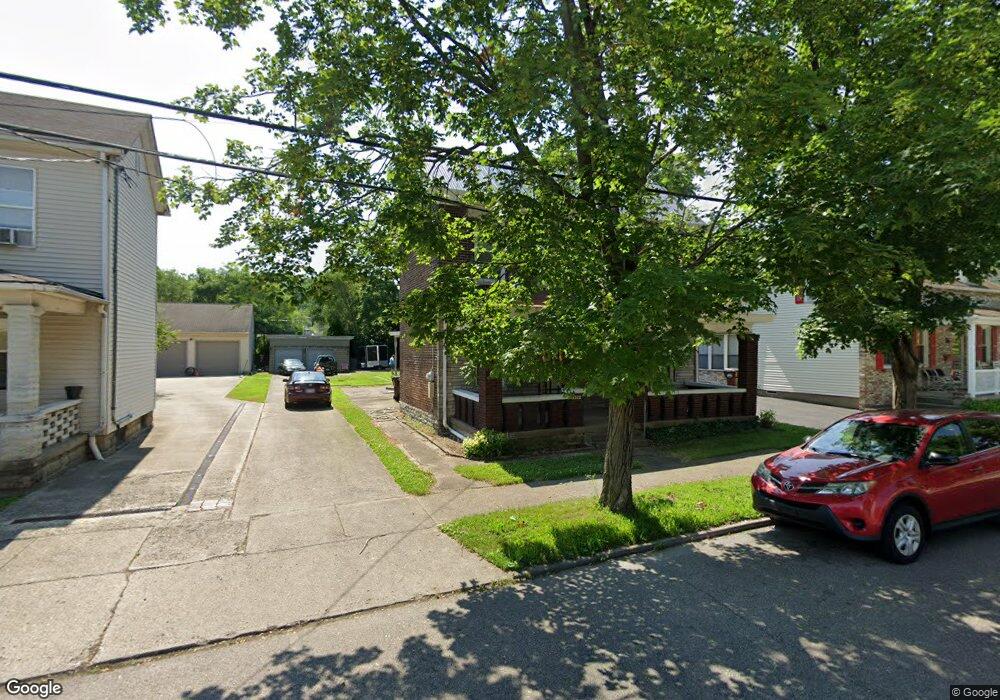
1320 Market St Cincinnati, OH 45215
Estimated Value: $185,000 - $264,000
4
Beds
1
Bath
2,125
Sq Ft
$103/Sq Ft
Est. Value
About This Home
This home is located at 1320 Market St, Cincinnati, OH 45215 and is currently estimated at $219,665, approximately $103 per square foot. 1320 Market St is a home located in Hamilton County with nearby schools including Reading Community High School, Saints Peter and Paul Academy, and Mount Notre Dame High School.
Ownership History
Date
Name
Owned For
Owner Type
Purchase Details
Closed on
Dec 6, 2019
Sold by
Kessling Bernard W and Kessling Stephanie
Bought by
Sbk Market Llc
Current Estimated Value
Purchase Details
Closed on
Feb 19, 2003
Sold by
Hucke Sandra A and Hucke Donald V
Bought by
Kessling Bernard W and Kessling Stephanie
Home Financials for this Owner
Home Financials are based on the most recent Mortgage that was taken out on this home.
Original Mortgage
$68,000
Interest Rate
6.07%
Purchase Details
Closed on
Nov 10, 1999
Sold by
Hucke Sandra A and Morari John E
Bought by
Morari Esther L
Purchase Details
Closed on
Jul 21, 1999
Sold by
Morari Esther L
Bought by
Morari Esther L and Hucke Sandra A
Create a Home Valuation Report for This Property
The Home Valuation Report is an in-depth analysis detailing your home's value as well as a comparison with similar homes in the area
Home Values in the Area
Average Home Value in this Area
Purchase History
| Date | Buyer | Sale Price | Title Company |
|---|---|---|---|
| Sbk Market Llc | -- | None Available | |
| Kessling Bernard W | $85,000 | -- | |
| Morari Esther L | -- | -- | |
| Morari Esther L | -- | -- |
Source: Public Records
Mortgage History
| Date | Status | Borrower | Loan Amount |
|---|---|---|---|
| Previous Owner | Kessling Bernard W | $68,000 |
Source: Public Records
Tax History
| Year | Tax Paid | Tax Assessment Tax Assessment Total Assessment is a certain percentage of the fair market value that is determined by local assessors to be the total taxable value of land and additions on the property. | Land | Improvement |
|---|---|---|---|---|
| 2025 | $2,498 | $45,990 | $10,465 | $35,525 |
| 2023 | $2,493 | $45,990 | $10,465 | $35,525 |
| 2022 | $1,962 | $28,109 | $8,418 | $19,691 |
| 2021 | $1,678 | $28,109 | $8,418 | $19,691 |
| 2020 | $1,655 | $28,109 | $8,418 | $19,691 |
| 2019 | $1,562 | $24,875 | $7,448 | $17,427 |
| 2018 | $1,564 | $24,875 | $7,448 | $17,427 |
| 2017 | $1,475 | $24,875 | $7,448 | $17,427 |
| 2016 | $1,777 | $30,069 | $7,889 | $22,180 |
| 2015 | $1,792 | $30,069 | $7,889 | $22,180 |
| 2014 | $1,568 | $30,069 | $7,889 | $22,180 |
| 2013 | $1,589 | $30,681 | $8,050 | $22,631 |
Source: Public Records
Map
Nearby Homes
- 134 Walnut St
- 129 Pike St
- 1401 Jefferson Ave
- 1421 Jefferson Ave
- 310 E Vine St
- 1521 Hunt Rd
- 329 Walnut St
- 654 3rd St
- 9350 Reading Rd
- 653 Harmes Ave
- 54 Gorman Ln
- 18 Gahl Terrace
- 26 Gahl Terrace
- 0 Hill St Unit 1616370
- 311 Southern Ave
- 234 Mcguire Ln
- 321 Southern Ave
- 2148 Julie Terrace
- 109 Calico Ct
- 636 Maple Dr
- 1316 Market St
- 1324 Market St
- 19 W Mechanic St
- 1330 Market St
- 30 Halker Ave
- 15 W Mechanic St
- 22 Halker Ave
- 26 Halker Ave
- 18 Halker Ave
- 11 W Mechanic St
- 9185 Reading Rd
- 1321 Market St
- 1319 Market St
- 1323 Market St
- 1325 Market St
- 1315 Market St
- 1311 Market St
- 25 Halker Ave
- 1306 Market St
- 1329 Market St
Your Personal Tour Guide
Ask me questions while you tour the home.