1320 Michael Ct Unit 158A Bayside, NY 11360
Bayside NeighborhoodEstimated Value: $626,000 - $828,000
--
Bed
--
Bath
1,190
Sq Ft
$648/Sq Ft
Est. Value
About This Home
This home is located at 1320 Michael Ct Unit 158A, Bayside, NY 11360 and is currently estimated at $771,243, approximately $648 per square foot. 1320 Michael Ct Unit 158A is a home located in Queens County with nearby schools including P.S. 209 - Clearview Gardens, J.H.S. 194 William Carr, and Bayside High School.
Ownership History
Date
Name
Owned For
Owner Type
Purchase Details
Closed on
Feb 26, 2024
Sold by
Lercara Erika and Reimerdes Erika
Bought by
Jiang Ye and Jiang Ying
Current Estimated Value
Home Financials for this Owner
Home Financials are based on the most recent Mortgage that was taken out on this home.
Original Mortgage
$230,000
Outstanding Balance
$226,217
Interest Rate
6.69%
Mortgage Type
Purchase Money Mortgage
Estimated Equity
$545,026
Purchase Details
Closed on
Feb 13, 2002
Sold by
Morganstein Marilyn
Bought by
Reimerdes Erika
Home Financials for this Owner
Home Financials are based on the most recent Mortgage that was taken out on this home.
Original Mortgage
$275,000
Interest Rate
6.91%
Mortgage Type
Purchase Money Mortgage
Purchase Details
Closed on
Apr 23, 1998
Sold by
Russo Nicholas and Russo Mary
Bought by
Morganstein Marilyn B
Create a Home Valuation Report for This Property
The Home Valuation Report is an in-depth analysis detailing your home's value as well as a comparison with similar homes in the area
Home Values in the Area
Average Home Value in this Area
Purchase History
| Date | Buyer | Sale Price | Title Company |
|---|---|---|---|
| Jiang Ye | $723,900 | -- | |
| Jiang Ye | $723,900 | -- | |
| Reimerdes Erika | -- | -- | |
| Reimerdes Erika | -- | -- | |
| Morganstein Marilyn B | $240,000 | First American Title Ins Co | |
| Morganstein Marilyn B | $240,000 | First American Title Ins Co |
Source: Public Records
Mortgage History
| Date | Status | Borrower | Loan Amount |
|---|---|---|---|
| Open | Jiang Ye | $230,000 | |
| Closed | Jiang Ye | $230,000 | |
| Previous Owner | Reimerdes Erika | $275,000 |
Source: Public Records
Tax History Compared to Growth
Tax History
| Year | Tax Paid | Tax Assessment Tax Assessment Total Assessment is a certain percentage of the fair market value that is determined by local assessors to be the total taxable value of land and additions on the property. | Land | Improvement |
|---|---|---|---|---|
| 2025 | $6,977 | $35,002 | $3,079 | $31,923 |
| 2024 | $6,977 | $34,735 | $3,338 | $31,397 |
| 2023 | $6,582 | $32,771 | $2,806 | $29,965 |
| 2022 | $6,172 | $41,514 | $3,811 | $37,703 |
| 2021 | $6,138 | $36,861 | $3,811 | $33,050 |
| 2020 | $6,174 | $37,217 | $3,811 | $33,406 |
| 2019 | $6,055 | $37,574 | $3,811 | $33,763 |
| 2018 | $5,567 | $27,309 | $3,731 | $23,578 |
| 2017 | $5,252 | $25,764 | $3,594 | $22,170 |
| 2016 | $4,859 | $25,764 | $3,594 | $22,170 |
| 2015 | $2,931 | $24,307 | $3,344 | $20,963 |
| 2014 | $2,931 | $24,122 | $3,348 | $20,774 |
Source: Public Records
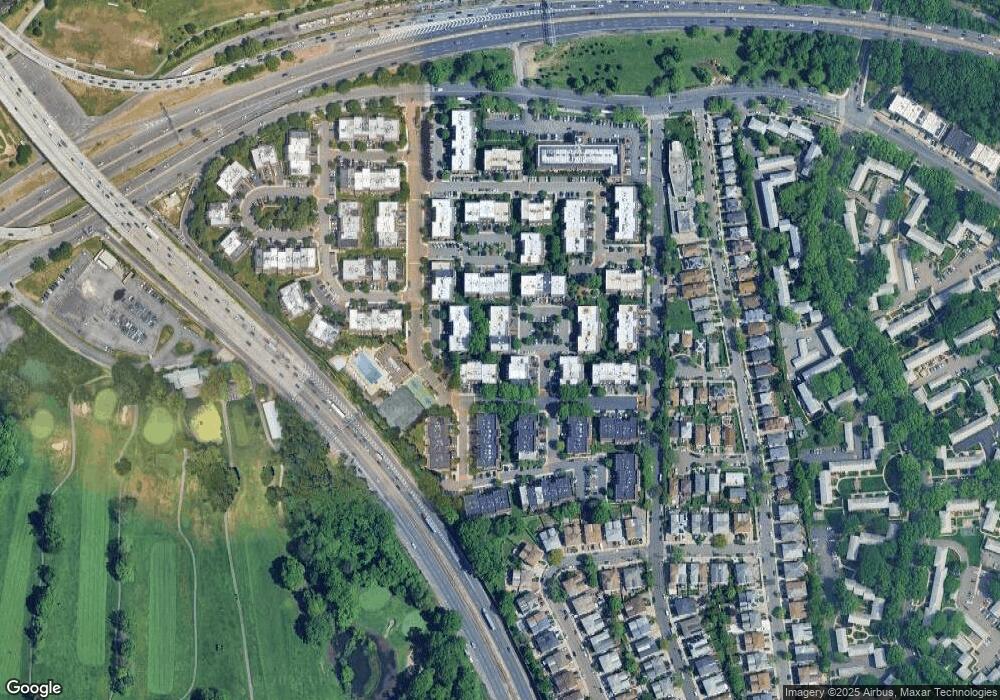
Map
Nearby Homes
- 12-34 Diane Place Unit 205 U
- 208-06 Robert Rd Unit 2
- 13-25 Estates Ln Unit 3F
- 12-36 Estates Ln Unit 49 L
- 14-04 Michael Place Unit 113 U
- 12-35 Robin Ln Unit Upper
- 12-31 Robin Ln Unit Triplex
- 208-08 Estates Dr Unit 22125
- 1404 Bonnie Ln Unit 15803
- 20607 Emily Rd Unit 3
- 15-01 Jordan Ct Unit 104M
- 15-01 Jordan Ct Unit 104 U
- 207-30 Jordan Dr Unit 97U
- 13-36 Robin Ln Unit 70 U
- 12-06 Robin Ln Unit 1028
- 13-40 212th St Unit 141
- 210 E 15th St Unit 6K
- 210 E 15th St Unit PHD
- 210 E 15th St Unit 2N
- 210 E 15th St Unit 6A
- 1320 Michael Ct
- 1320 Michael Ct
- 1318 Michael Ct
- 1318 Michael Ct
- 1318 Michael Ct Unit 1582
- 1318 Michael Ct Unit 1581
- 13-16 Michael Ct Unit 156L
- 1316 Michael Ct
- 1316 Michael Ct Unit 15
- 13-16 Michael Ct
- 13-16 Michael Ct Unit 158U
- 1316 Michael Ct Unit 1579
- 1316 Michael Ct Unit 1580
- 13-14 Michael Ct
- 13-14 Michael Ct Unit 155 L
- 1314 Michael Ct
- 1314 Michael Ct
- 1314 Michael Ct Unit 1578
- 1314 Michael Ct Unit 1577
- 1314 Michael Ct Unit L