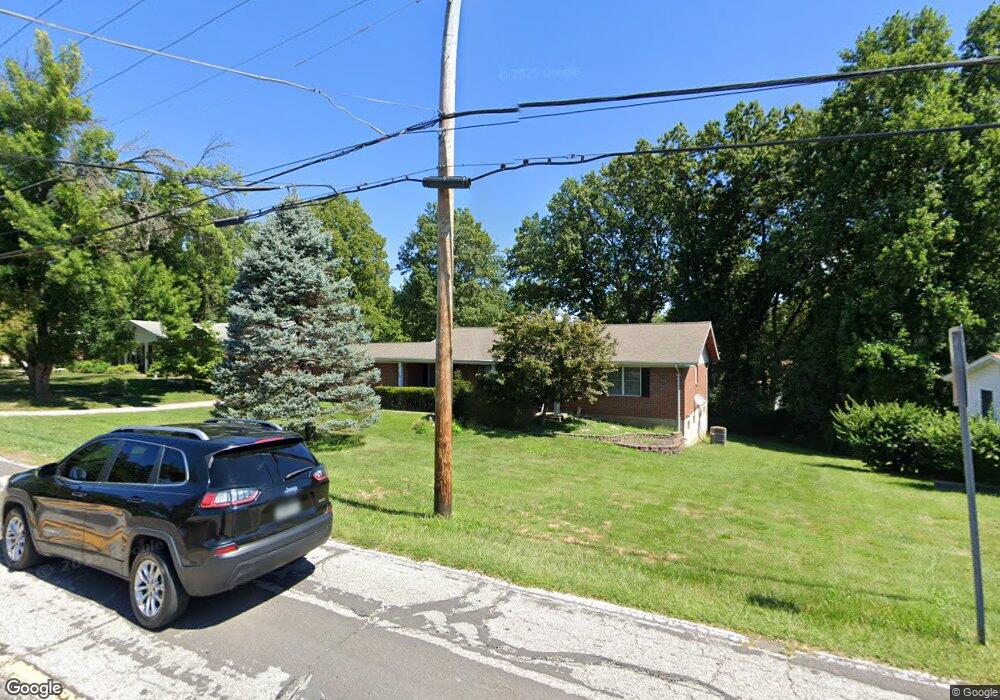
1320 N Elizabeth Ave Saint Louis, MO 63135
Estimated Value: $182,000 - $230,000
3
Beds
2
Baths
1,536
Sq Ft
$136/Sq Ft
Est. Value
About This Home
This home is located at 1320 N Elizabeth Ave, Saint Louis, MO 63135 and is currently estimated at $208,669, approximately $135 per square foot. 1320 N Elizabeth Ave is a home located in St. Louis County with nearby schools including Lee Hamilton Elementary School, Ferguson Middle School, and McCluer High School.
Ownership History
Date
Name
Owned For
Owner Type
Purchase Details
Closed on
Nov 24, 2003
Sold by
Tomblin Gene and Tomblin Jeane
Bought by
Dampf Charles D and Dampf Kathy A
Current Estimated Value
Home Financials for this Owner
Home Financials are based on the most recent Mortgage that was taken out on this home.
Original Mortgage
$112,000
Outstanding Balance
$51,296
Interest Rate
5.94%
Mortgage Type
Purchase Money Mortgage
Estimated Equity
$157,373
Purchase Details
Closed on
Jan 30, 2001
Sold by
Whitten Retha D
Bought by
Tomblin Gene and Tomblin Jeane
Home Financials for this Owner
Home Financials are based on the most recent Mortgage that was taken out on this home.
Original Mortgage
$73,000
Interest Rate
7.21%
Purchase Details
Closed on
Nov 30, 1998
Sold by
Eades Virginia R and Eades Roger L
Bought by
Whitten Retha D
Home Financials for this Owner
Home Financials are based on the most recent Mortgage that was taken out on this home.
Original Mortgage
$101,943
Interest Rate
6.69%
Mortgage Type
FHA
Create a Home Valuation Report for This Property
The Home Valuation Report is an in-depth analysis detailing your home's value as well as a comparison with similar homes in the area
Home Values in the Area
Average Home Value in this Area
Purchase History
| Date | Buyer | Sale Price | Title Company |
|---|---|---|---|
| Dampf Charles D | $140,000 | -- | |
| Tomblin Gene | $113,500 | Archway Title Agency Inc | |
| Tomblin Gene | -- | Archway Title Agency Inc | |
| Whitten Retha D | $102,000 | -- |
Source: Public Records
Mortgage History
| Date | Status | Borrower | Loan Amount |
|---|---|---|---|
| Open | Dampf Charles D | $112,000 | |
| Previous Owner | Tomblin Gene | $73,000 | |
| Previous Owner | Whitten Retha D | $101,943 |
Source: Public Records
Tax History Compared to Growth
Tax History
| Year | Tax Paid | Tax Assessment Tax Assessment Total Assessment is a certain percentage of the fair market value that is determined by local assessors to be the total taxable value of land and additions on the property. | Land | Improvement |
|---|---|---|---|---|
| 2025 | $2,530 | $38,610 | $7,010 | $31,600 |
| 2024 | $2,530 | $35,100 | $3,520 | $31,580 |
| 2023 | $2,530 | $35,100 | $3,520 | $31,580 |
| 2022 | $2,228 | $27,060 | $4,580 | $22,480 |
| 2021 | $2,156 | $27,060 | $4,580 | $22,480 |
| 2020 | $2,190 | $24,720 | $5,260 | $19,460 |
| 2019 | $2,148 | $24,720 | $5,260 | $19,460 |
| 2018 | $2,233 | $22,930 | $3,210 | $19,720 |
| 2017 | $2,189 | $22,930 | $3,210 | $19,720 |
| 2016 | $1,997 | $20,560 | $3,550 | $17,010 |
| 2015 | $2,010 | $20,560 | $3,550 | $17,010 |
| 2014 | $2,082 | $21,070 | $4,960 | $16,110 |
Source: Public Records
Map
Nearby Homes
- 401 Calverton Rd
- 810 Chateau Valley Ct
- 823 Le Maisson Dr
- 1226 Beaver Trail Dr
- 655 Hunters Ridge Dr
- 15 Lake Pembroke Dr
- 6 Sandringham Ln
- 941 N Elizabeth Ave
- 1562 Starlight Dr
- 1609 Willow Wren Ct Unit 203
- 1502 Summer Run Dr Unit 306
- 1502 Summer Run Dr Unit 109
- 925 Dyerdown Ave
- 1606 Willow Wren Ct Unit 109
- 16 White Dr
- 8 Buckeye Dr
- 18 White Dr
- 716 Nancy Place
- 13 Cady Dr
- 1315 Hendrick Dr
- 1326 N Elizabeth Ave
- 518 Chartier Dr
- 1314 N Elizabeth Ave
- 510 Chartier Dr
- 522 Chartier Dr
- 504 Monceau Dr
- 500 Chartier Dr
- 523 Chartier Dr
- 509 Chartier Dr
- 528 Chartier Dr
- 1308 Alicia Ave
- 1325 N Elizabeth Ave
- 514 Monceau Dr
- 1303 N Elizabeth Ave
- 609 Chartier Dr
- 501 Monceau Dr
- 600 Chartier Dr
- 619 Chartier Dr
- 515 Monceau Dr
- 604 Chartier Dr