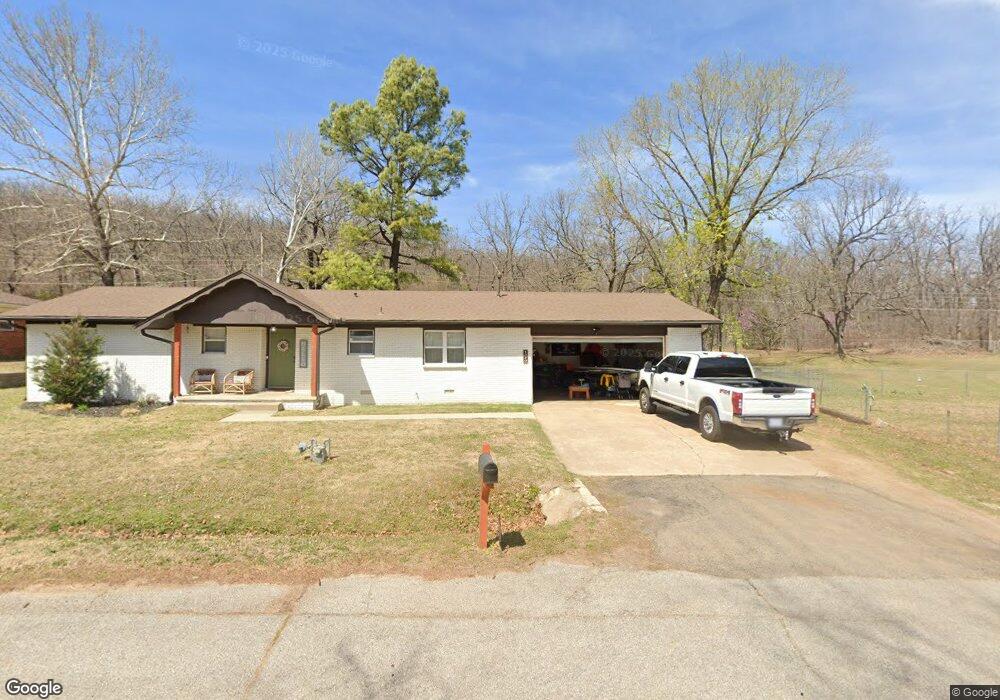
1320 N Euchee Creek Blvd Sand Springs, OK 74063
Estimated Value: $191,000 - $201,000
3
Beds
3
Baths
1,346
Sq Ft
$145/Sq Ft
Est. Value
About This Home
This home is located at 1320 N Euchee Creek Blvd, Sand Springs, OK 74063 and is currently estimated at $195,605, approximately $145 per square foot. 1320 N Euchee Creek Blvd is a home located in Tulsa County with nearby schools including Garfield STEAM Academy, Northwoods Fine Arts Academy, and Clyde Boyd Middle School.
Ownership History
Date
Name
Owned For
Owner Type
Purchase Details
Closed on
Dec 29, 2020
Sold by
Nave James Lee
Bought by
Herndon Brooke L and Buttrey Clay B
Current Estimated Value
Home Financials for this Owner
Home Financials are based on the most recent Mortgage that was taken out on this home.
Original Mortgage
$147,283
Outstanding Balance
$131,358
Interest Rate
2.67%
Mortgage Type
FHA
Estimated Equity
$64,247
Purchase Details
Closed on
Jul 15, 2020
Sold by
Martin Patricia A and Taber Carla S
Bought by
Nave James Lee
Home Financials for this Owner
Home Financials are based on the most recent Mortgage that was taken out on this home.
Original Mortgage
$56,000
Interest Rate
3.1%
Mortgage Type
Commercial
Purchase Details
Closed on
Jun 20, 2005
Sold by
Martin Patricia A
Bought by
Martin Patricia A and Taber Carla S
Create a Home Valuation Report for This Property
The Home Valuation Report is an in-depth analysis detailing your home's value as well as a comparison with similar homes in the area
Home Values in the Area
Average Home Value in this Area
Purchase History
| Date | Buyer | Sale Price | Title Company |
|---|---|---|---|
| Herndon Brooke L | $150,000 | Apex Ttl & Closing Serviecs | |
| Nave James Lee | $45,000 | Apex Title & Closing Svcs | |
| Martin Patricia A | -- | -- |
Source: Public Records
Mortgage History
| Date | Status | Borrower | Loan Amount |
|---|---|---|---|
| Open | Herndon Brooke L | $147,283 | |
| Previous Owner | Nave James Lee | $56,000 |
Source: Public Records
Tax History Compared to Growth
Tax History
| Year | Tax Paid | Tax Assessment Tax Assessment Total Assessment is a certain percentage of the fair market value that is determined by local assessors to be the total taxable value of land and additions on the property. | Land | Improvement |
|---|---|---|---|---|
| 2024 | $2,187 | $18,150 | $2,200 | $15,950 |
| 2023 | $2,187 | $17,325 | $2,100 | $15,225 |
| 2022 | $2,036 | $16,500 | $2,200 | $14,300 |
| 2021 | $1,276 | $10,176 | $2,200 | $7,976 |
| 2020 | $1,269 | $9,773 | $1,852 | $7,921 |
| 2019 | $1,194 | $9,460 | $1,793 | $7,667 |
| 2018 | $1,125 | $9,154 | $1,838 | $7,316 |
| 2017 | $1,068 | $9,859 | $1,980 | $7,879 |
| 2016 | $1,058 | $9,604 | $1,929 | $7,675 |
| 2015 | $1,039 | $9,859 | $1,980 | $7,879 |
| 2014 | $1,014 | $9,053 | $1,980 | $7,073 |
Source: Public Records
Map
Nearby Homes
- 405 Loop Dr
- 14615 W 17th St S
- 1008 N Grant Ave
- 14925 W 17th St S
- 820 N Grant Ave
- 917 N Grant Ave
- 0 N Franklin Ave
- 13644 Shell Creek Rd
- 600 N Franklin Ave
- 907 N Wilson Ave
- 518 N Franklin Ave
- 1015 N Cleveland Ave
- 416 N Franklin Ave
- 405 N Industrial Ave
- 307 N Industrial Ave
- 824 Long St
- 14515 Mockingbird Ln
- 14510 Mockingbird Ln
- 306 N Grant Ave
- 608 N Roosevelt Ave
- 1318 N Euchee Creek Blvd
- 1324 N Euchee Creek Blvd
- 1316 N Euchee Creek Blvd
- 1319 N Euchee Creek Blvd
- 1321 N Euchee Creek Blvd
- 1313 N Euchee Creek Blvd
- 1314 N Euchee Creek Blvd
- 1400 N Willow Rd
- 1311 N Euchee Creek Blvd
- 1314 N Willow Rd
- 1206 N Euchee Creek Place
- 1205 N Euchee Creek Place
- 1309 N Euchee Creek Blvd
- 1312 N Euchee Creek Blvd
- 1204 N Euchee Creek Place
- 1310 N Willow Rd
- 1307 N Euchee Creek Blvd
- 1310 N Euchee Creek Blvd
- 1308 N Willow Rd
- 1202 N Euchee Creek Place