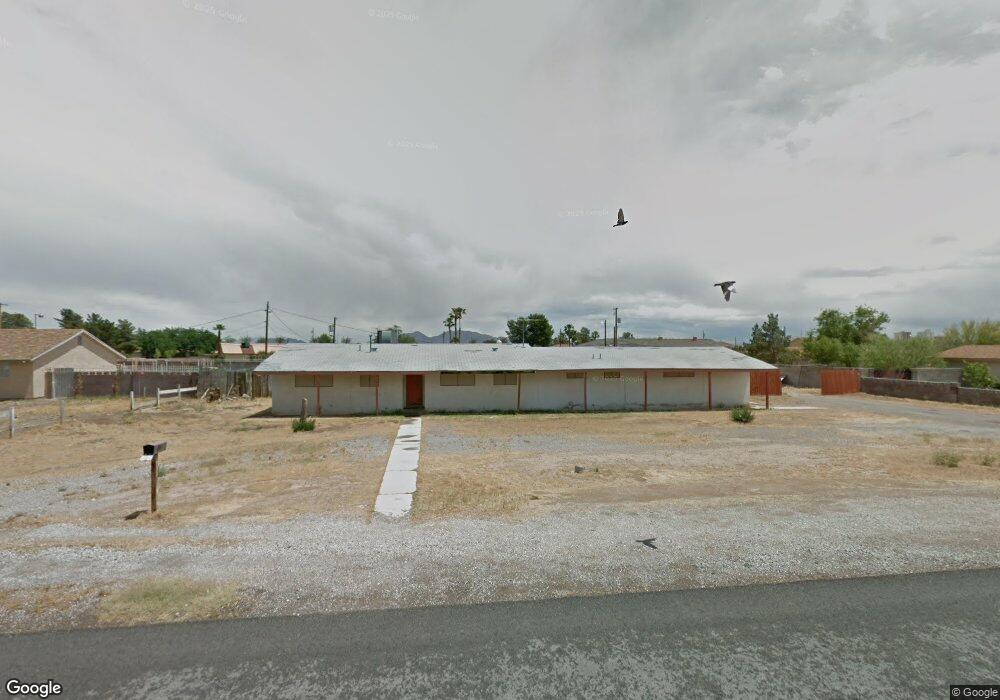
1320 Ralston Dr Las Vegas, NV 89106
West Las Vegas NeighborhoodEstimated Value: $535,000 - $635,000
3
Beds
3
Baths
1,944
Sq Ft
$301/Sq Ft
Est. Value
About This Home
This home is located at 1320 Ralston Dr, Las Vegas, NV 89106 and is currently estimated at $585,304, approximately $301 per square foot. 1320 Ralston Dr is a home located in Clark County with nearby schools including Wendell P. Williams Elementary School, West Prepatory Academy At Charlles I West Hall Sec, and Western High School.
Ownership History
Date
Name
Owned For
Owner Type
Purchase Details
Closed on
Oct 22, 2024
Sold by
Miller James Donald and Miller Linda M
Bought by
Miller Linda M
Current Estimated Value
Home Financials for this Owner
Home Financials are based on the most recent Mortgage that was taken out on this home.
Original Mortgage
$870,000
Outstanding Balance
$787,849
Interest Rate
6.72%
Mortgage Type
FHA
Estimated Equity
-$202,545
Purchase Details
Closed on
Aug 23, 2019
Sold by
Miller Janne D
Bought by
Miller Janes D and Millo Lurda M
Purchase Details
Closed on
Oct 27, 1993
Sold by
Coon Mary Louise
Bought by
Miller James D
Home Financials for this Owner
Home Financials are based on the most recent Mortgage that was taken out on this home.
Original Mortgage
$81,370
Interest Rate
6.97%
Mortgage Type
FHA
Create a Home Valuation Report for This Property
The Home Valuation Report is an in-depth analysis detailing your home's value as well as a comparison with similar homes in the area
Home Values in the Area
Average Home Value in this Area
Purchase History
| Date | Buyer | Sale Price | Title Company |
|---|---|---|---|
| Miller Linda M | -- | First American Title Insurance | |
| Miller Janes D | -- | None Available | |
| Miller James D | $81,500 | Lawyers Title |
Source: Public Records
Mortgage History
| Date | Status | Borrower | Loan Amount |
|---|---|---|---|
| Open | Miller Linda M | $870,000 | |
| Previous Owner | Miller Linda M | $870,000 | |
| Previous Owner | Miller James D | $81,370 |
Source: Public Records
Tax History Compared to Growth
Tax History
| Year | Tax Paid | Tax Assessment Tax Assessment Total Assessment is a certain percentage of the fair market value that is determined by local assessors to be the total taxable value of land and additions on the property. | Land | Improvement |
|---|---|---|---|---|
| 2025 | $1,274 | $85,823 | $59,500 | $26,323 |
| 2024 | $1,237 | $85,823 | $59,500 | $26,323 |
| 2023 | $1,232 | $83,305 | $59,500 | $23,805 |
| 2022 | $1,201 | $70,643 | $49,350 | $21,293 |
| 2021 | $1,167 | $60,076 | $40,250 | $19,826 |
| 2020 | $1,130 | $52,499 | $33,250 | $19,249 |
| 2019 | $1,097 | $51,774 | $33,250 | $18,524 |
| 2018 | $1,046 | $41,934 | $24,500 | $17,434 |
| 2017 | $1,313 | $40,060 | $22,750 | $17,310 |
| 2016 | $1,232 | $34,204 | $17,500 | $16,704 |
| 2015 | $1,225 | $31,168 | $14,000 | $17,168 |
| 2014 | $1,195 | $28,088 | $10,500 | $17,588 |
Source: Public Records
Map
Nearby Homes
- 1301 Madison Ave
- 1713 Ophir Dr
- 1310 N Tonopah Dr
- 1101 Leonard Ave
- 1980 Hydrangea Place
- 1982 Hydrangea Place
- 1974 Hydrangea Place
- 1978 Hydrangea Place
- 1984 Hydrangea Place
- 1976 Hydrangea Place
- 1641 K St
- 1121 W Monroe Ave
- 1636 J St
- 2045 Rose Coral Ave
- 1648 J St
- 1212 Eleanor Ave
- 2100 Port Ave
- 1117 Cunningham Dr
- 1018 I St
- 211 W Monroe Ave
- 1310 Ralston Dr
- 1330 Ralston Dr
- 1321 Sharon Rd
- 1331 Sharon Rd
- 1311 Sharon Rd
- 1321 Ralston Dr
- 1300 Ralston Dr
- 1331 Ralston Dr
- 1311 Ralston Dr
- 1301 Sharon Rd
- 1726 Sutro Ln
- 1732 Sutro Ln
- 1301 Ralston Dr
- 1401 Sharon Rd
- 1800 Sutro Ln
- 1220 Ralston Dr
- 1231 Sharon Rd
- 1320 Sharon Rd
- 1810 Sutro Ln
- 1322 Comstock Dr