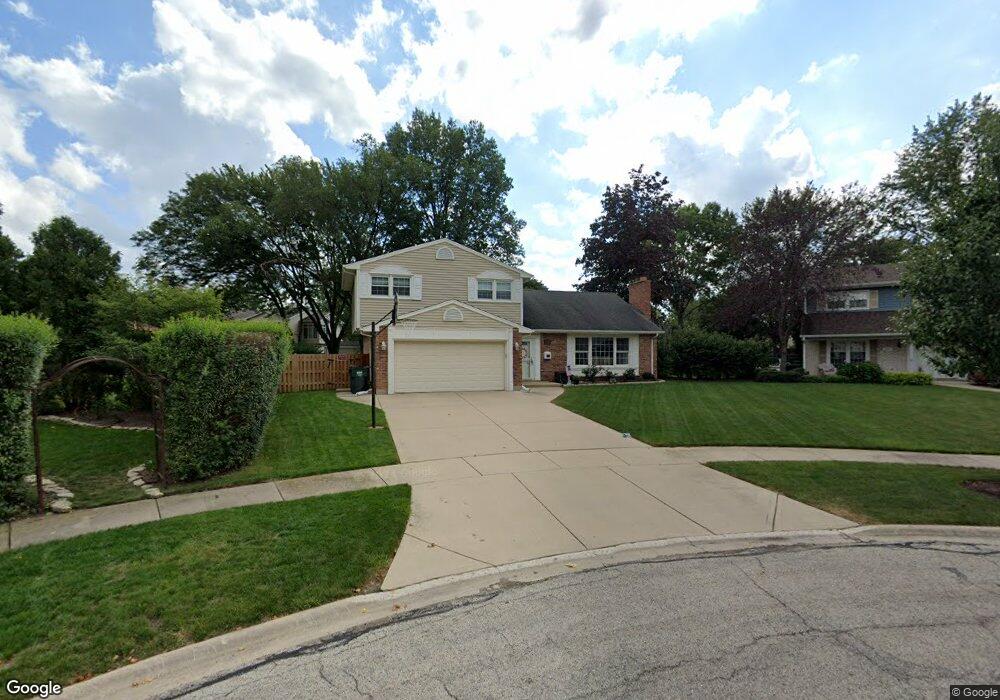
1320 S Fernandez Ct Arlington Heights, IL 60005
Estimated Value: $555,860 - $629,000
3
Beds
3
Baths
1,802
Sq Ft
$323/Sq Ft
Est. Value
About This Home
This home is located at 1320 S Fernandez Ct, Arlington Heights, IL 60005 and is currently estimated at $582,215, approximately $323 per square foot. 1320 S Fernandez Ct is a home located in Cook County with nearby schools including Holmes Jr High School, Juliette Low Elementary School, and Rolling Meadows High School.
Ownership History
Date
Name
Owned For
Owner Type
Purchase Details
Closed on
May 9, 2024
Sold by
Tripicchio Donna and Schaffer Michelle
Bought by
Donna S Tripicchio Living Trust and Michelle K Schaffer Living Trust
Current Estimated Value
Purchase Details
Closed on
Aug 3, 2009
Sold by
Tello Francisco M and Mcfarlin Tello Gloria J
Bought by
Tripicchio Donna and Schaffer Michelle
Home Financials for this Owner
Home Financials are based on the most recent Mortgage that was taken out on this home.
Original Mortgage
$285,600
Interest Rate
5.36%
Mortgage Type
Unknown
Purchase Details
Closed on
Jan 22, 2003
Sold by
Serna Matthew W and Serna Nancy Lee
Bought by
Tello Francisco M and Mcfarlin Tello Gloria J
Home Financials for this Owner
Home Financials are based on the most recent Mortgage that was taken out on this home.
Original Mortgage
$100,000
Interest Rate
5.96%
Create a Home Valuation Report for This Property
The Home Valuation Report is an in-depth analysis detailing your home's value as well as a comparison with similar homes in the area
Home Values in the Area
Average Home Value in this Area
Purchase History
| Date | Buyer | Sale Price | Title Company |
|---|---|---|---|
| Donna S Tripicchio Living Trust | -- | None Listed On Document | |
| Tripicchio Donna | $357,000 | Attorneys Title Guaranty Fun | |
| Tello Francisco M | $350,000 | Atgf Inc |
Source: Public Records
Mortgage History
| Date | Status | Borrower | Loan Amount |
|---|---|---|---|
| Previous Owner | Tripicchio Donna | $285,600 | |
| Previous Owner | Tello Francisco M | $100,000 |
Source: Public Records
Tax History Compared to Growth
Tax History
| Year | Tax Paid | Tax Assessment Tax Assessment Total Assessment is a certain percentage of the fair market value that is determined by local assessors to be the total taxable value of land and additions on the property. | Land | Improvement |
|---|---|---|---|---|
| 2024 | $9,490 | $40,000 | $9,845 | $30,155 |
| 2023 | $9,029 | $40,000 | $9,845 | $30,155 |
| 2022 | $9,029 | $40,000 | $9,845 | $30,155 |
| 2021 | $8,331 | $32,809 | $6,399 | $26,410 |
| 2020 | $8,156 | $32,809 | $6,399 | $26,410 |
| 2019 | $8,315 | $36,864 | $6,399 | $30,465 |
| 2018 | $9,314 | $36,737 | $5,414 | $31,323 |
| 2017 | $9,196 | $36,737 | $5,414 | $31,323 |
| 2016 | $8,831 | $36,737 | $5,414 | $31,323 |
| 2015 | $8,975 | $32,357 | $4,922 | $27,435 |
| 2014 | $8,859 | $32,357 | $4,922 | $27,435 |
| 2013 | $8,645 | $32,357 | $4,922 | $27,435 |
Source: Public Records
Map
Nearby Homes
- 1306 S Walnut Ave
- 1107 W White Oak St
- 1607 S Kaspar Ave
- 306 W Noyes St
- 1114 S Fernandez Ave
- 1025 S Fernandez Ave Unit 4C
- 1025 S Fernandez Ave Unit 3M
- 1708 S Fernandez Ave
- 1355 S Dunton Ave
- 1510 W Russell Ct
- 1306 S New Wilke Rd Unit 2B
- 1322 S New Wilke Rd Unit 1C
- 5406 Chateau Unit 4
- 1860 W Surrey Park Ln Unit 1C
- 1206 S New Wilke Rd Unit 108
- 1227 S Old Wilke Rd Unit 12209
- 1227 S Old Wilke Rd Unit 306
- 1207 S Old Wilke Rd Unit 303
- 1217 S Old Wilke Rd Unit 11406
- 1602 W Orchard Place Unit 1602C
- 1318 S Fernandez Ct
- 806 W Noyes St
- 1326 S Fernandez Ave
- 1330 S Fernandez Ave
- 810 W Noyes St
- 802 W Noyes St
- 1316 S Fernandez Ct
- 1327 S Kaspar Ave
- 1319 S Kaspar Ave
- 1314 S Fernandez Ct
- 1312 S Fernandez Ct
- 1310 S Fernandez Ct
- 1315 S Kaspar Ave
- 803 W Noyes St
- 1308 S Fernandez Ave
- 807 W Noyes St
- 1311 S Kaspar Ave
- 1327 S Fernandez Ave
- 1331 S Fernandez Ave
- 710 W Noyes St