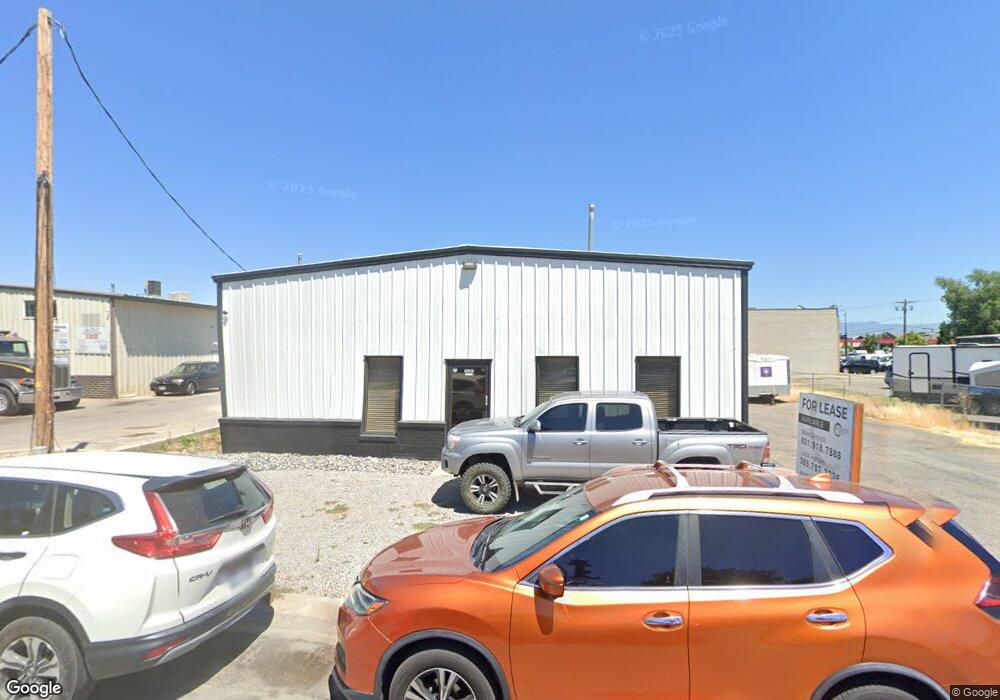
1320 W 7900 S West Jordan, UT 84088
Estimated Value: $1,386,714
--
Bed
--
Bath
4,000
Sq Ft
$347/Sq Ft
Est. Value
About This Home
This home is located at 1320 W 7900 S, West Jordan, UT 84088 and is currently estimated at $1,386,714, approximately $346 per square foot. 1320 W 7900 S is a home located in Salt Lake County with nearby schools including Riverside Elementary School, West Jordan Middle School, and West Jordan High School.
Ownership History
Date
Name
Owned For
Owner Type
Purchase Details
Closed on
Jul 21, 2023
Sold by
Garcia Raul and Garcia Debra Ann
Bought by
Zm Robertson Enterprise Llc and Assigns Llc
Current Estimated Value
Home Financials for this Owner
Home Financials are based on the most recent Mortgage that was taken out on this home.
Original Mortgage
$677,500
Interest Rate
6.71%
Mortgage Type
Construction
Purchase Details
Closed on
Sep 21, 2016
Sold by
Garcia Mary M
Bought by
Garcia Raul
Purchase Details
Closed on
Sep 20, 2016
Sold by
Garcia Raul
Bought by
Garcia Raul and Garcia Debra Ann
Create a Home Valuation Report for This Property
The Home Valuation Report is an in-depth analysis detailing your home's value as well as a comparison with similar homes in the area
Home Values in the Area
Average Home Value in this Area
Purchase History
| Date | Buyer | Sale Price | Title Company |
|---|---|---|---|
| Zm Robertson Enterprise Llc | -- | Truly Title | |
| Garcia Raul | -- | Monument Title Ins Co | |
| Garcia Raul | -- | Monument Title Ins Co |
Source: Public Records
Mortgage History
| Date | Status | Borrower | Loan Amount |
|---|---|---|---|
| Previous Owner | Zm Robertson Enterprise Llc | $677,500 | |
| Previous Owner | Zm Robertson Enterprise Llc | $542,000 |
Source: Public Records
Tax History Compared to Growth
Tax History
| Year | Tax Paid | Tax Assessment Tax Assessment Total Assessment is a certain percentage of the fair market value that is determined by local assessors to be the total taxable value of land and additions on the property. | Land | Improvement |
|---|---|---|---|---|
| 2025 | $6,183 | $761,800 | $170,100 | $591,700 |
| 2024 | $6,183 | $654,300 | $146,400 | $507,900 |
| 2023 | $4,620 | $460,800 | $110,700 | $350,100 |
| 2022 | $4,151 | $407,300 | $94,900 | $312,400 |
| 2021 | $3,973 | $354,900 | $83,100 | $271,800 |
| 2020 | $3,568 | $299,100 | $79,100 | $220,000 |
| 2019 | $3,660 | $300,800 | $75,200 | $225,600 |
| 2018 | $3,329 | $271,400 | $71,200 | $200,200 |
| 2017 | $2,797 | $227,000 | $68,000 | $159,000 |
| 2016 | $3,240 | $247,100 | $66,400 | $180,700 |
| 2015 | $3,116 | $231,700 | $64,900 | $166,800 |
| 2014 | $2,746 | $201,000 | $63,300 | $137,700 |
Source: Public Records
Map
Nearby Homes
- 7657 Sunrise Place E
- 8155 S Redwood Rd Unit 88
- 8155 S Redwood Rd Unit 142B
- 8155 S Redwood Rd Unit 95
- 8155 S Redwood Rd Unit 28
- 7693 S Redwood Rd
- 1039 W Rooftop Dr
- 1037 Soho Dr
- 1516 W 7470 S
- 1805 W 7600 S Unit D204
- 1678 Leland Dr
- 1790 W Sugar Factory Rd
- 1801 W 7600 S Unit C201
- 1817 W 7600 S Unit I204
- 1689 W 8295 S Unit 2
- 1829 W 7600 S Unit G301
- 7340 S Seven Tree Ln Unit 76
- 1384 W 7290 S
- 7645 S 1960 W
- 1235 W Athleen Dr