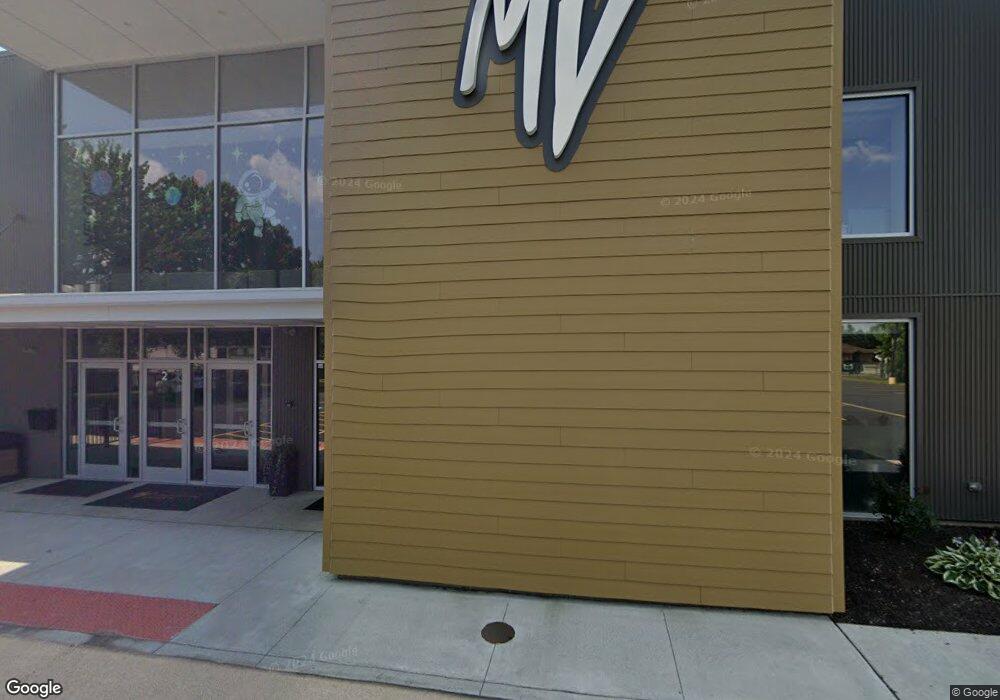
1320 W Maple St North Canton, OH 44720
Estimated Value: $448,600
--
Bed
3
Baths
27,114
Sq Ft
$17/Sq Ft
Est. Value
About This Home
This home is located at 1320 W Maple St, North Canton, OH 44720 and is currently priced at $448,600, approximately $16 per square foot. 1320 W Maple St is a home located in Stark County with nearby schools including Orchard Hill Intermediate School, North Canton Middle School, and Hoover High School.
Ownership History
Date
Name
Owned For
Owner Type
Purchase Details
Closed on
Mar 10, 2020
Sold by
West Maple Propertes Ltd
Bought by
Church Missionview
Current Estimated Value
Purchase Details
Closed on
Oct 20, 2016
Sold by
Pegasus Holdings Ltd
Bought by
West Maple Properties Ltd
Purchase Details
Closed on
Aug 1, 2016
Sold by
United States Of America
Bought by
Pegasus Holdings Ltd
Purchase Details
Closed on
Jun 23, 2010
Sold by
Ohpaky Inc and Church William M
Bought by
Ceroni John Richard and Ceroni Adale Marie
Purchase Details
Closed on
May 10, 1995
Sold by
National Electronic Inst
Bought by
Ohpaky Inc
Home Financials for this Owner
Home Financials are based on the most recent Mortgage that was taken out on this home.
Original Mortgage
$230,000
Interest Rate
8.39%
Mortgage Type
New Conventional
Create a Home Valuation Report for This Property
The Home Valuation Report is an in-depth analysis detailing your home's value as well as a comparison with similar homes in the area
Home Values in the Area
Average Home Value in this Area
Purchase History
| Date | Buyer | Sale Price | Title Company |
|---|---|---|---|
| Church Missionview | $300,000 | Patriot Title Agency Inc | |
| West Maple Properties Ltd | -- | None Available | |
| Pegasus Holdings Ltd | $265,000 | Prism Title & Closing Servic | |
| Ceroni John Richard | $500,000 | Lawyers Title-Akron | |
| Ohpaky Inc | $435,000 | -- |
Source: Public Records
Mortgage History
| Date | Status | Borrower | Loan Amount |
|---|---|---|---|
| Previous Owner | Ohpaky Inc | $230,000 |
Source: Public Records
Tax History Compared to Growth
Tax History
| Year | Tax Paid | Tax Assessment Tax Assessment Total Assessment is a certain percentage of the fair market value that is determined by local assessors to be the total taxable value of land and additions on the property. | Land | Improvement |
|---|---|---|---|---|
| 2025 | $49 | -- | -- | -- |
| 2024 | -- | $348,780 | $74,940 | $273,840 |
| 2023 | $20 | $340,520 | $58,170 | $282,350 |
| 2022 | $126 | $274,050 | $58,170 | $215,880 |
| 2021 | $7,839 | $115,020 | $55,200 | $59,820 |
| 2020 | $7,811 | $109,550 | $52,570 | $56,980 |
| 2019 | $7,393 | $109,560 | $52,570 | $56,990 |
| 2018 | $9,365 | $109,560 | $52,570 | $56,990 |
| 2017 | $6,570 | $96,820 | $45,710 | $51,110 |
| 2016 | $0 | $98,540 | $46,520 | $52,020 |
| 2015 | $10,694 | $313,710 | $45,710 | $268,000 |
| 2014 | $568 | $290,440 | $42,320 | $248,120 |
| 2013 | $10,558 | $290,440 | $42,320 | $248,120 |
Source: Public Records
Map
Nearby Homes
- 1222 W Maple St Unit 6A
- 1246 W Maple St Unit 4A
- 1236 W Maple St
- 0 W Maple St Unit 5135089
- 1171 Terrace Rd NW
- 727 Lorena St SW
- 742 Portage St NW
- 624 Portage St NW
- 608 Werstler Ave NW
- 1138 Lindy Lane Ave SW
- 1015 Lois Ave NW
- 1276 Linwood Ave SW
- 455 Royer Ave NW
- 404 7th St NW
- 404 Cordelia St SW
- 140 5th St NE
- 253 Glenwood St SW
- 1263 Los Angeles Blvd NW
- 1482 Democracy Dr NW
- 6285 Cherry Blossom Cir NW
- 1230 W Maple St
- 1220 W Maple St Unit 6B
- 1220 W Maple St
- 1232 W Maple St
- 1246 W Maple St
- 1216 W Maple St
- 1244 W Maple St
- 1206 W Maple St
- 1214 W Maple St Unit 6E
- 1402 W Maple St
- 1208 W Maple St
- 1226 W Maple St
- 1242 W Maple St Unit 4C
- 1212 W Maple St Unit 6F
- 1240 W Maple St Unit 4D
- 1202 W Maple St Unit 7E
- 1238 W Maple St
- 1228 W Maple St
- 1200 W Maple St Unit 7F
- 1224 W Maple St Unit 5F