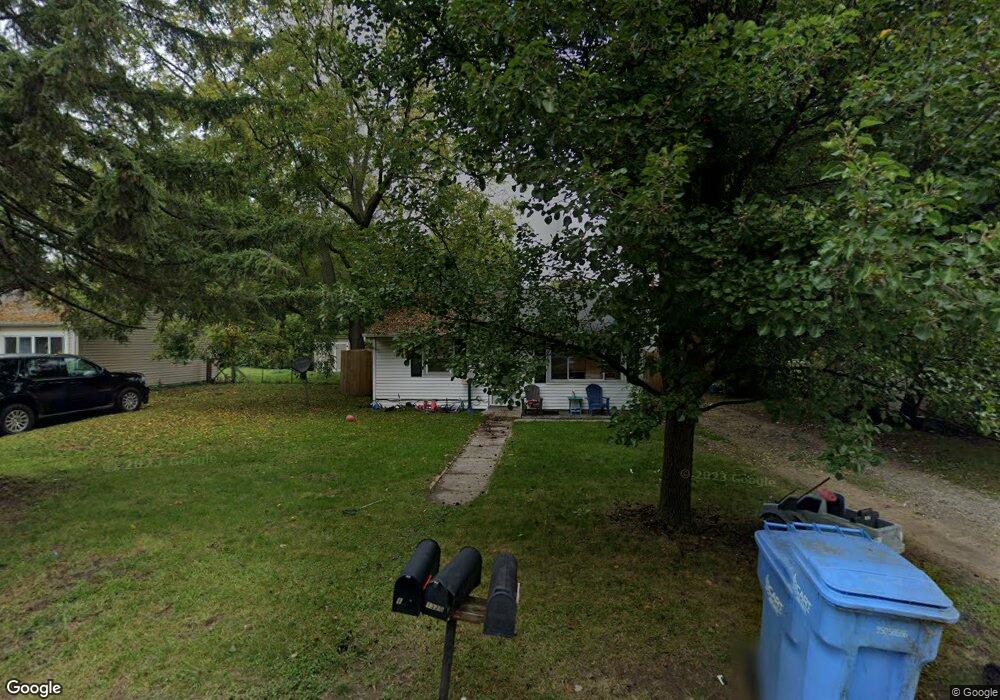
1320 Warwick Dr Lansing, MI 48910
Pleasant Grove NeighborhoodEstimated Value: $73,000 - $103,000
2
Beds
1
Bath
707
Sq Ft
$127/Sq Ft
Est. Value
About This Home
This home is located at 1320 Warwick Dr, Lansing, MI 48910 and is currently estimated at $89,642, approximately $126 per square foot. 1320 Warwick Dr is a home located in Ingham County with nearby schools including Reo Elementary School, Attwood School, and Everett High School.
Ownership History
Date
Name
Owned For
Owner Type
Purchase Details
Closed on
Jul 22, 2019
Sold by
Ellis Joy Ann
Bought by
Claybrooks Rickisha and Reed Dereal
Current Estimated Value
Purchase Details
Closed on
May 28, 2013
Sold by
Secretary Of Hud
Bought by
Ellis Jody Ann
Purchase Details
Closed on
Feb 7, 2013
Sold by
Jpmorgan Chase Bank Na
Bought by
The Secretary Of Hud
Purchase Details
Closed on
Sep 13, 2012
Sold by
Blom Joshua A
Bought by
Jpmorgan Chase Bank National Association
Purchase Details
Closed on
Jun 4, 2003
Sold by
Gregory Charles B
Bought by
Blom Josh
Home Financials for this Owner
Home Financials are based on the most recent Mortgage that was taken out on this home.
Original Mortgage
$52,584
Interest Rate
5.71%
Mortgage Type
FHA
Purchase Details
Closed on
Jan 17, 2002
Sold by
Gregory Charles B
Bought by
Gregory Charles B
Purchase Details
Closed on
Oct 15, 2001
Sold by
Gregory Norabelle H and Gregory Charles R
Bought by
Gregory Charles B
Create a Home Valuation Report for This Property
The Home Valuation Report is an in-depth analysis detailing your home's value as well as a comparison with similar homes in the area
Home Values in the Area
Average Home Value in this Area
Purchase History
| Date | Buyer | Sale Price | Title Company |
|---|---|---|---|
| Claybrooks Rickisha | $30,000 | None Available | |
| Ellis Jody Ann | $15,702 | None Available | |
| The Secretary Of Hud | -- | None Available | |
| Jpmorgan Chase Bank National Association | $8,000 | None Available | |
| Blom Josh | $53,000 | Transnation | |
| Gregory Charles B | -- | -- | |
| Gregory Charles B | -- | -- |
Source: Public Records
Mortgage History
| Date | Status | Borrower | Loan Amount |
|---|---|---|---|
| Previous Owner | Blom Josh | $52,584 |
Source: Public Records
Tax History
| Year | Tax Paid | Tax Assessment Tax Assessment Total Assessment is a certain percentage of the fair market value that is determined by local assessors to be the total taxable value of land and additions on the property. | Land | Improvement |
|---|---|---|---|---|
| 2025 | $1,636 | $33,200 | $5,900 | $27,300 |
| 2024 | $12 | $28,900 | $5,900 | $23,000 |
| 2023 | $1,537 | $25,600 | $5,900 | $19,700 |
| 2022 | $1,390 | $24,100 | $5,900 | $18,200 |
| 2021 | $1,361 | $21,800 | $4,400 | $17,400 |
| 2020 | $1,352 | $20,700 | $4,400 | $16,300 |
| 2019 | $1,472 | $20,600 | $4,400 | $16,200 |
| 2018 | $1,398 | $17,600 | $4,400 | $13,200 |
| 2017 | $1,345 | $17,600 | $4,400 | $13,200 |
| 2016 | $1,031 | $17,400 | $4,400 | $13,000 |
| 2015 | $1,031 | $16,900 | $8,740 | $8,160 |
| 2014 | $1,031 | $17,400 | $11,472 | $5,928 |
Source: Public Records
Map
Nearby Homes
- 1422 Warwick Dr
- 1319 Hillcrest St
- VL Hillcrest St
- 1113 Eaton Ct
- 0 Eaton Ct
- 1715 Hillcrest St
- 3815 Walton Dr
- 1904 Hillcrest St
- 0 Burchfield Dr
- 3705 Burchfield Dr
- 1429 Pierce Rd
- 3429 Lowcroft Ave
- 4414 S Martin Luther King jr Blvd
- 924 Loa St
- 823 Loa St
- 1420 Reo Rd
- 4125 Lowcroft Ave
- 1604 Peggy Place
- 1926 Peggy St
- 3723 Weger Place
- 1314 Warwick Dr
- 1404 Warwick Dr
- 1308 Warwick Dr
- 1410 Warwick Dr
- 1413 Warwick Dr
- 3602 Marion Ave
- 1319 Warwick Dr
- 1401 Warwick Dr
- 1315 Warwick Dr
- 1419 Warwick Dr
- 1305 Warwick Dr
- 1418 Warwick Dr
- 1435 Warwick Dr
- 1238 Warwick Dr
- 1428 Warwick Dr
- 1241 Warwick Dr
- 1420 Pompton Cir
- 1402 Pompton Cir
- 1330 Pompton Cir
- 1232 Warwick Dr
Your Personal Tour Guide
Ask me questions while you tour the home.