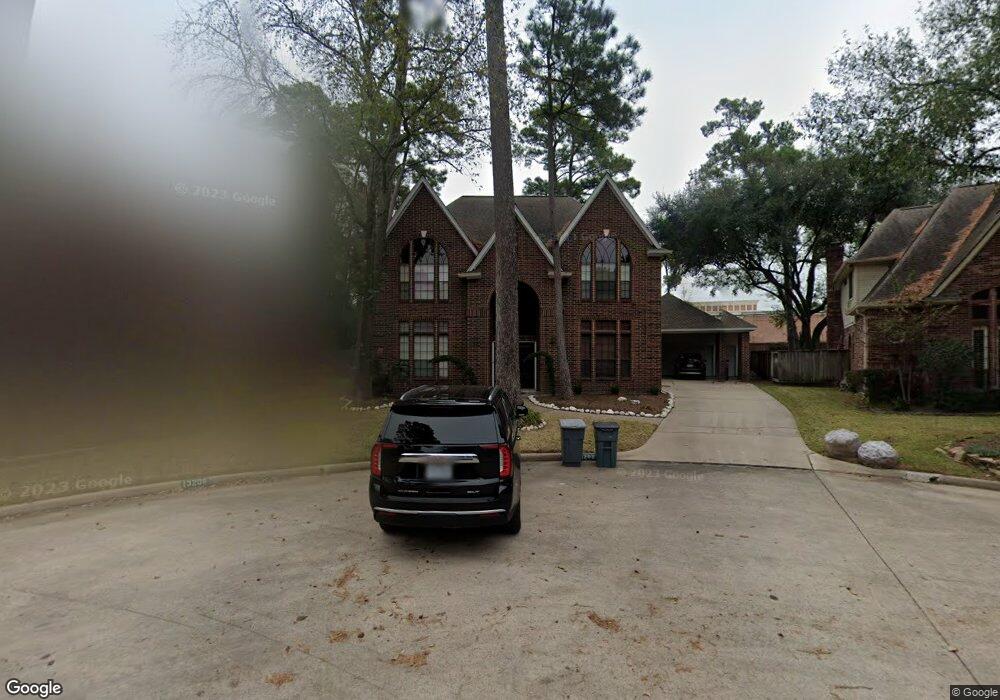
13202 Allysum Ct Cypress, TX 77429
Estimated Value: $461,986 - $481,000
4
Beds
4
Baths
3,231
Sq Ft
$146/Sq Ft
Est. Value
About This Home
This home is located at 13202 Allysum Ct, Cypress, TX 77429 and is currently estimated at $470,247, approximately $145 per square foot. 13202 Allysum Ct is a home located in Harris County with nearby schools including Hamilton Elementary School, Hamilton Middle School, and Cy-Fair High School.
Ownership History
Date
Name
Owned For
Owner Type
Purchase Details
Closed on
Dec 23, 2003
Sold by
Johnson Bradley D
Bought by
Scott Edwin L and Scott Leslea
Current Estimated Value
Home Financials for this Owner
Home Financials are based on the most recent Mortgage that was taken out on this home.
Original Mortgage
$207,000
Outstanding Balance
$103,349
Interest Rate
7%
Mortgage Type
Purchase Money Mortgage
Estimated Equity
$366,898
Purchase Details
Closed on
Jul 19, 2001
Sold by
Kosley Alan K and Kosley Betty F
Bought by
Johnson Bradley
Home Financials for this Owner
Home Financials are based on the most recent Mortgage that was taken out on this home.
Original Mortgage
$174,600
Interest Rate
7.15%
Purchase Details
Closed on
Nov 1, 1995
Sold by
Haight Michael T and Haight Katherine Witt
Bought by
Kosley Alan K and Kosley Betty F
Home Financials for this Owner
Home Financials are based on the most recent Mortgage that was taken out on this home.
Original Mortgage
$148,750
Interest Rate
7.58%
Create a Home Valuation Report for This Property
The Home Valuation Report is an in-depth analysis detailing your home's value as well as a comparison with similar homes in the area
Home Values in the Area
Average Home Value in this Area
Purchase History
| Date | Buyer | Sale Price | Title Company |
|---|---|---|---|
| Scott Edwin L | -- | Chicago Title Cypress | |
| Johnson Bradley | -- | Chicago Title | |
| Kosley Alan K | -- | -- |
Source: Public Records
Mortgage History
| Date | Status | Borrower | Loan Amount |
|---|---|---|---|
| Open | Scott Edwin L | $207,000 | |
| Previous Owner | Johnson Bradley | $174,600 | |
| Previous Owner | Kosley Alan K | $148,750 | |
| Closed | Scott Edwin L | $11,500 |
Source: Public Records
Tax History Compared to Growth
Tax History
| Year | Tax Paid | Tax Assessment Tax Assessment Total Assessment is a certain percentage of the fair market value that is determined by local assessors to be the total taxable value of land and additions on the property. | Land | Improvement |
|---|---|---|---|---|
| 2025 | $6,652 | $458,519 | $93,123 | $365,396 |
| 2024 | $6,652 | $417,368 | $93,123 | $324,245 |
| 2023 | $6,652 | $459,985 | $93,123 | $366,862 |
| 2022 | $8,659 | $459,985 | $71,594 | $388,391 |
| 2021 | $8,294 | $328,903 | $71,594 | $257,309 |
| 2020 | $8,174 | $314,247 | $47,563 | $266,684 |
| 2019 | $8,452 | $313,147 | $47,563 | $265,584 |
| 2018 | $3,465 | $331,990 | $47,563 | $284,427 |
| 2017 | $8,946 | $331,990 | $47,563 | $284,427 |
| 2016 | $8,946 | $331,990 | $47,563 | $284,427 |
| 2015 | $6,362 | $331,990 | $47,563 | $284,427 |
| 2014 | $6,362 | $289,532 | $47,563 | $241,969 |
Source: Public Records
Map
Nearby Homes
- 13214 Allysum Ct
- 13206 Vinca Ct
- 13219 Allysum Ct
- 12938 Quail Park Dr
- 13302 Autumn Valley Dr
- 13018 Wincrest Ct
- 13114 Kathy Ln
- 12910 Lake Mist Dr
- 51 Wincrest Falls Dr
- 13306 April Mist Ct
- 13323 Golden Valley Dr
- 13012 Kathy Ln
- 11718 Imperial Woods Ln
- 13715 Meadow Sweet Dr
- 12911 Bristol Berry Dr
- 13106 Youngfield Dr
- 13807 Meadow Sweet Dr
- 12911 Peach Meadow Dr
- 12903 Cluster Pine Dr
- 11627 Wilcant Ln
- 13206 Allysum Ct
- 13203 Allysum Ct
- 13210 Allysum Ct
- 13203 Vinca Ct
- 13207 Allysum Ct
- 13211 Vinca Ct
- 13211 Allysum Ct
- 13215 Vinca Ct
- 13215 Allysum Ct
- 13202 Vinca Ct
- 13210 Vinca Ct
- 13111 Allysum Ln
- 13107 Allysum Ln
- 13115 Allysum Ln
- 13214 Vinca Ct
- 13103 Allysum Ln
- 13119 Allysum Ln
- 13123 Allysum Ln
- 13060 Grant Rd
- 13110 Lemur Ln